The intense competition in the e-commerce industry has pushed leaders in that niche to use new and innovative methods of marketing, sales, delivery and customer experience. The explosive adoption of Smartphone and social media has helped marketing, sales and customer experience. While on-time product delivery, by far, remains the biggest challenge.
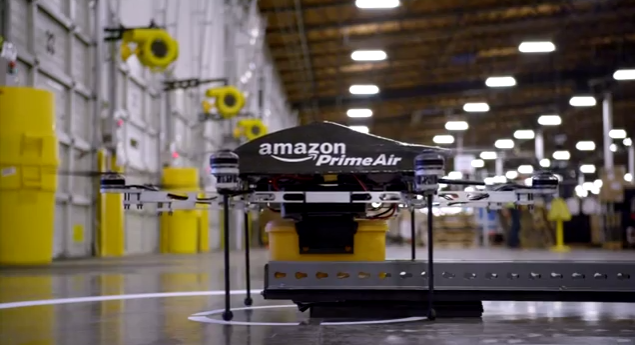
Imagine apparels, gadgets or any other product, you just bought online, being delivered on your terrace – by a drone! Yes, CEO of Amazon.com Inc. (NASDAQ:AMZN), Jeff Bezos says that this could the reality in the next five to six years and shoppers will witness a whole new level of shopping experience.
In a recent interview to CBS’s 60 Minutes, Bezos displayed the next generation delivery mechanism, or call it Delivery Drones, that will deliver the product within a few hours of purchase, probably. He has named the service as Prime Air and these delivery drones could carry packages up to five pounds and can travel 10 miles in less than 30 minutes.
“These are Octocopters..These are effectively drones, but there’s no reason these can’t be used as delivery vehicles.” – Jeff Bezos.
The service is, however, at quite an early stage of development and besides operating challenges could involve various legal hurdles that Amazon needs to over come. Federal Aviation Administration (FAA) in the U.S. is yet to define rules that must be followed by any unnamed flying vehicle.
But Bezos sees this coming and expects that the Prime Air service could be initiated within four to five years. He seems quite positive towards FAA approval and sees no reason why the authorities will register any objections against such an intuitive delivery mechanism. Apparently, the company is confident about the service and has acknowledged it on its own landing page.
Prime Air Holds Prime Challenges Too
The service comes with possible challenges like – crash or stealing. For a company that has got high hopes and has made a sizable investment in a service which targets environments which can’t always be controlled, it would be interesting but challenging to ensure the success.
For those who are excited to see how the Prime Air service will work, Amazon has made a video demonstration, available to all. The video after this break:
Facebook Inc. (NASDAQ:FB) is swallowing a major share of social media advertising revenue, out playing Twitter Inc. (NYSE:TWTR) and other social networking sites. According to the Wallstreetpr, Facebook is expected to grab the major share of the predicted total digital ad spent worth $9.4 billion this holiday shopping season. Retail brands on Facebook are estimated to contribute the biggest pie of this ad spend. Last year, Facebook earned 90% of total ad-spent during the holiday shopping season compared to 10% by Twitter. Facebook is pacing itself exceedingly well, both in retail and mobile advertising sections and a majority of advertisers are looking to shell out more cash to publicise their product to the 1.189 billion monthly active users (of Facebook) rather than a mere 232 million MAUs of Twitter. Facebook has more than 73.5% or 874 million of the total user base who enjoy its services on mobile platforms whereas Twitter which was born as a mobile network has a mere 173 million users on mobile.
Retail Brands On Facebook Have 45x More Followers Than That On Twitter
The graph below depicts brand fans of top 10 retailer brands of the U.S in comparison with followers of the same brand on Twitter. If we compare the number one retail brand Walmart – the number of Facebook fans are approximately 34 million whereas on Twitter it is hardly 421,000 plus followers (currently the figure is 425,000+). A similar situation was observed in case of Target which had 22.5 million Facebook fans and 971,ooo plus Twitter followers (number of followers as of now – 978,000+), Macy’s has 13.4 million Facebook fans which is much more when compared to its 318,000 plus Twitter followers (currently they have 323,000 plus Twitter followers). Retail brands on Facebook on an average have 45x more brand fans than followers on Twitter. Facebook is shaping up well according to the demands of advertisers and fast-changing trends in the advertising industry. Facebook had initially faced many issues like – a large number of users shifting to the mobile platform, advertisers demanding more specific ad-campaigns, indigestible metrics for measuring ad success, lack of advertising initiatives for brands with niche audiences and a lot more.
But the way Facebook has evolved in the last 1 year to resolve the above mentioned issues is quite commendable. It has successfully transformed its desktop success to the mobile platform with more than 874 million users actively using their services on the mobile phones and tablets. It has galloped at a swooping pace in addressing the issues of advertisers by initiatives like better location specific and gender based ad-campaigns, custom audience feature – an Ad campaign based on contact details of individual users (niche audience), a better insight of ad success report, Preferred Marketing developers program and the reviews feature. It has also revolutionized its mobile technology to drive a major chunk of the referral rate, which recently shot up to a whopping 253%.
Facebook Brand Engagement Is More Than Total Followers On Twitter Of The Same Brand!
It is indeed important to have followers for any brand page, but the engagement is more decisive, amount of user-engagement decides growth of a brand. Facebook yet again outplays Twitter – on an average 340,000 Facebook fans engage (sharing and talking about) with the top 10 retail brands on a weekly basis, which is undoubtedly much more than engagement on Twitter and in some cases is more than the overall fan base of same brands on Twitter. If we analyze the graph below, the engagement rate by Facebook fan base of Avon is 540,000 whereas it’s Twitter followers are just 70,000.
Twitter is the undisputed leader amongst social media networks when it comes to the mobile space whereas Facebook’s numerous features do not fit well on the mobile screens. But the micro-blogging site has not yet capitalized its mobile dominance that well in terms of advertising of retail brands, providing hefty returns to the advertisers and an increasing count of active tweeting users. Even though advertiser are well aware of the fact that features like tweet and re-tweet are a much more valuable form of engagement than like or share (in Facebook), the active user base which actually bothers to tweet is rather miniscule and disappointing. More than 84.6% or 764.78 million of Twitter’s registered users are passive and hardly bother to Tweet. Twitter lags behind Facebook in driving referral traffic to online websites.
Although, Twitter lately realized the importance of visual feeds and introduced inclusion of pictures and videos within the tweet, the feature is yet to be properly integrated with its various advertising schemes, hence very few advertisers are able to analyze its impact. Twitter is failing to innovate itself in the advertising arena when compared to Facebook, it is not yet able to meet the sophisticated demands of advertisers for targeting specific audiences. It’s success story is more convincing only in developed markets, whereas most of the advertisers from emerging markets are not very convinced about Twitter’s Ad results.
According to an August poll by Shop.org, nearly 34% claimed to have spent a major share of advertising budget on Facebook prior to the holiday shopping season, about 28% said Pinterest Inc., 19% upvoted for photo sharing app – Instagram and a mere 15% said Twitter. Perhaps networking sites with better visual representation or photos were more successful in driving them customers.
Future Of San Francisco Based 140 Char Microblogging Service!
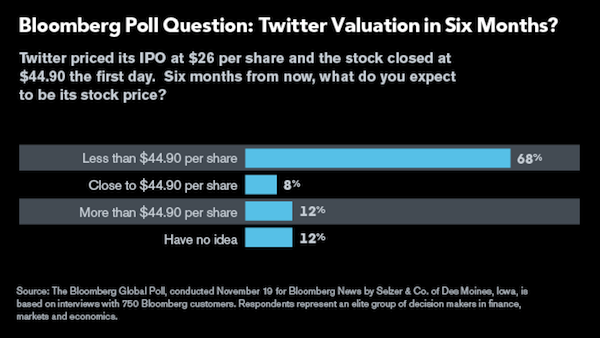
Thousands of public investors have showed faith in Twitter and are hoping that it continues to dominate social media in the future. Twitter is now using public money and they ought to take a couple of brainstorming initiatives to boost its growth at a faster rate. According to Bloomberg Global Poll which interviews 750 customers, around 68% of the investors predicted that stocks would fall below its first day closure of $44.90 within the next 6 months.
J.J. Hirschle, who was recently hired to grab in more retailers to advertise on the platform, held meetings with Best Buy Co. (BBY), Target Corp. (TGT) and other big retailers to opt for Twitter for marketing their product. According to eMarketer Inc, Retail spending on digital ads contributed to 22% of the total expenditure in 2012, and this figure is expected to rise further from $9.4 billion this year to $13.5 billion by 2017. Currently, a major share of it is pocketed by Facebook, Twitter needs to accelerate, in order to harness a substantial increment in its share and continue with the sparkling IPO momentum a little longer. Twitter lags behind Facebook in terms of marketing dollars from retail brands who are known to spend a vulgar amount of cash on digital ads.
Twitter should also focus on the talent hiring arena as employers consider an average Twitter user to be more intellectual than a Facebook user. The micro-blogging site should try to entice wayward users and increase its actively tweeting user base. It is important for Twitter to educate users and advertisers of emerging markets about its customs and traditions and how its explosive and viral nature and real-time conversation features can continue to evolve the communication modes of users worldwide.
Twitter should focus on some of its other products like Vine, which hasn’t changed much in the last couple of quarters and the user base is increasing at snail’s pace, whereas Facebook revised its photo sharing app Instagram, which has more than 150 million users and growing, and was monetized recently to attract advertisers and promote user engagement with brands. Twitter’s mobile advertising exchange MoPub, hasn’t been in news since its acquisition.
Social media and mobile devices are an inseparable part of human life and are largely affecting their day-to-day activities. The increasing usage of mobile devices and social media has been a game changer when it comes to the manner in which people shop for their favorite products. The landscape of shopping is shifting to Smartphones and tablets at a faster rate due to the large comfort screens of mobile devices, a number of brands are opting for mobile optimized websites and are increasing the adoption of social media by brands (as users spend maximum time on social media). Most of the brands across the world have opted for mobile first strategy due to an increase in usage of Smartphones and a shift in the user base of social media sites to the mobile platform. Social media sites like Facebook Inc. (NASDAQ:FB), Pinterest, Twitter Inc. (NYSE:TWTR) drive significant amount of referral rate to shopping sites.
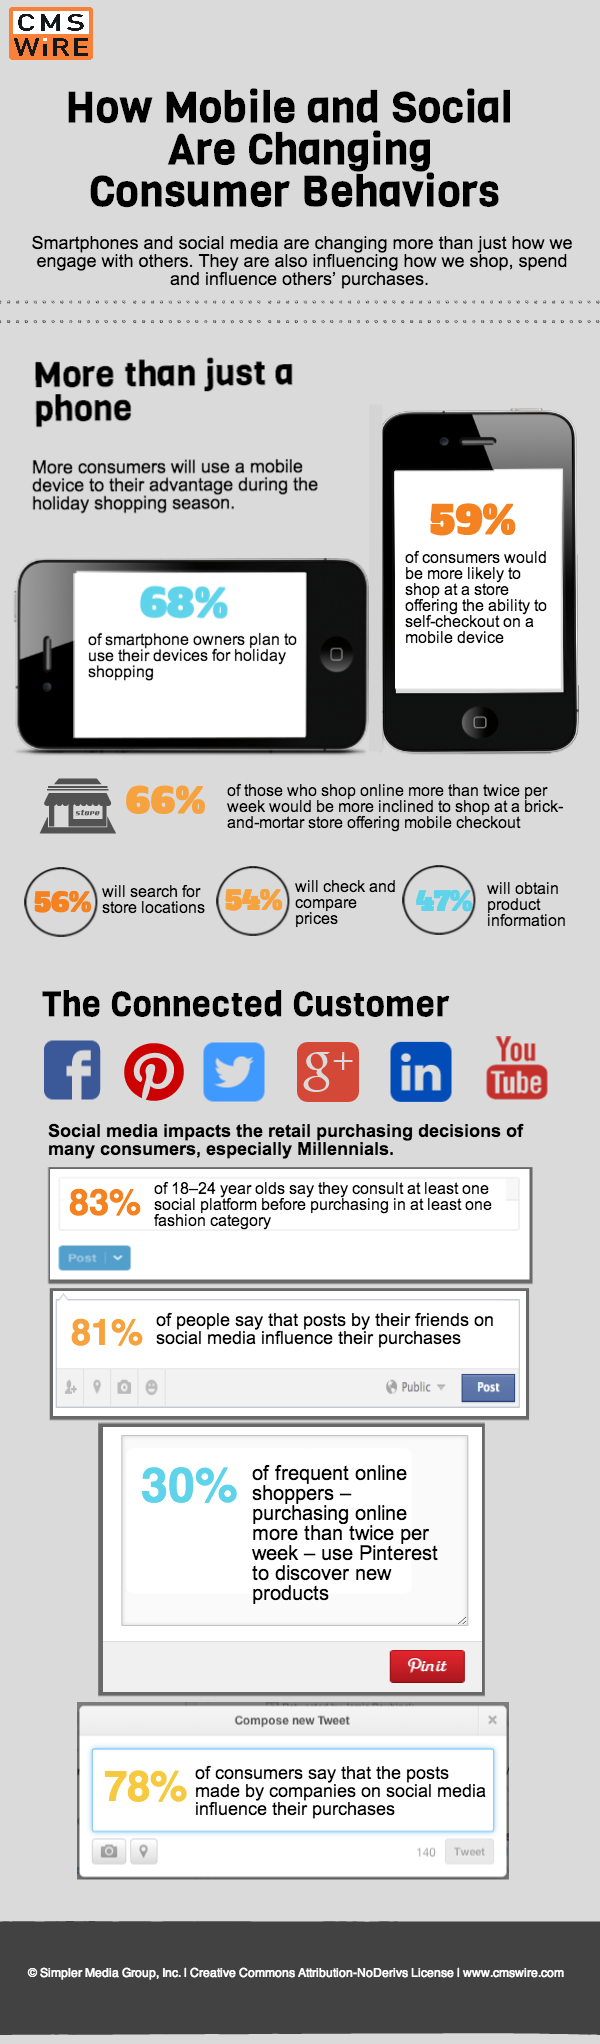
An infographic from CMS Wire presents some interesting statistics on how mobile devices (Smartphones and tablets) and social media have revolutionized the landscape of consumer’s shopping behavior.
Nearly 68% of Smartphone owners plan to use their devices for holiday shopping. The screen size of latest Smartphones are well within the comfort range of shoppers who browse through products and shop online.
About 59% of consumers are more likely to shop at a store offering the ability to self-checkout on a mobile device. Hence, it is vital for an online store and brand to adopt mobile first strategy and design a mobile optimized website.
Close to 83% of folks in the age group of 18-24 years say they consult at least one social media platform before purchasing in at least one fashion category. Brand pages must avail various attractive deals and discounts or gift coupons for social media followers to increase conversions.
About 81% of people say that posts by their friends on social media influence their purchases. It is vital for firms to moderate their brand pages continuously on social media platforms and answer to customer queries at the earliest, else the negative vibes generated by the frustrated customers might influence other brand followers and deteriorate the brand image.
30% of frequent online shoppers purchasing online more than twice per week, use Pinterest to discover new products. Pinterest has introduced numerous features like related pins, holiday gifts feed and holiday gift guide which is likely to attract shopaholics to use the website to plan their shopping schedule.
Nearly 78% of consumers say that the posts made by companies on social media influence their purchases. It is vital from brands to post content which is informative, entertaining and cleverly mixed with the brand’s message. Usage of rich media content, infographic and catchy taglines is likely to engage more consumers.
The growing number of events in India has created an opportunity for aspiring entrepreneurs to fix the major issues of an industry which is often disorganised. Ticket booking and event promotion are one of the major concerns for event organising companies and this has incubated an online business model for many Startups, trying to grab the opportunity with both hands.
Internet users in India just passed the 200 million mark and is estimated to reach 213 million by end of 2013. Only 9% of total active Internet users, however, transact online in spite of the growing adoption rate of Internet, education and supporting ecosystem. But, considering the fact that e-commerce players in India have just scratched the surface, online event ticket booking industry is emerging with a promising valuation of Rs. 5,000 Cr and players, such as Meraevents.com, are keeping an eye on the biggest pie in the market, registering rapid growth of 400% – 500% annually.
Today, we have nearly 20,000 daily visitors, checking for new events and what is happening in their respective industry. This gives a platform to the organizers who can sell more tickets in an easier and cost-effective manner, resulting in lesser costs for a ticket. Definitely, it takes time for organisers to understand the system though, but once they understand the tremendous value of such a platform, the growth is enormous, says Mr. Chennapa Naidu, CEO and Founder – MeraEvents.com
Online Payment and Security remain the biggest challenge. The e-commerce industry in India also suffers from a few long standing challenges. The trend is slowly shifting though online shoppers are yet to show confidence in e-payment. Nearly 30% – 50% of buyers still opt for COD (Cash-On-Delivery) or OSP (On-Spot-Payment), which is still a major concern for event organizers who realise the cash either after the successfully conducted event or with a delayed time frame.
We see 90 – 95% transactions on MeraEvents.com happening online through Credit/Debit card and Net Banking. However, in order to make customers more comfortable with this purchase, we have tied up with several third-parties to enable the COD facility and deliver tickets on the customer’s door steps, says Mr. Naidu.
We spoke to Mr. Naidu in an exclusive discussion on Online Event Ticketing Industry in India. The full-length interview explains the growth of MeraEvents.com along with the opportunity in the industry they are pursuing, the challenges, customer acquisition and investment opportunities.
Facebook Inc. (NASDAQ:FB), thanks to its all round growth is emerging as a daily go-to website for web users across the globe. Facebook has effectively evolved itself and is providing its 1.26 billion active users (as per Q3 ,2013 report total MAUs were 1.189 billion) with all their daily needs like brand engagement, news consumption, social networking, chatting and a whole lot more. Facebook with its ever growing advertising initiatives is providing more specific ad-campaigns using which marketers can target the audience of their choice and hence promote better conversion rates. Marketers across the globe are now well accustomed to various Facebook advertising techniques and are investing a major share of investment for specific ad-campaigns on the site.
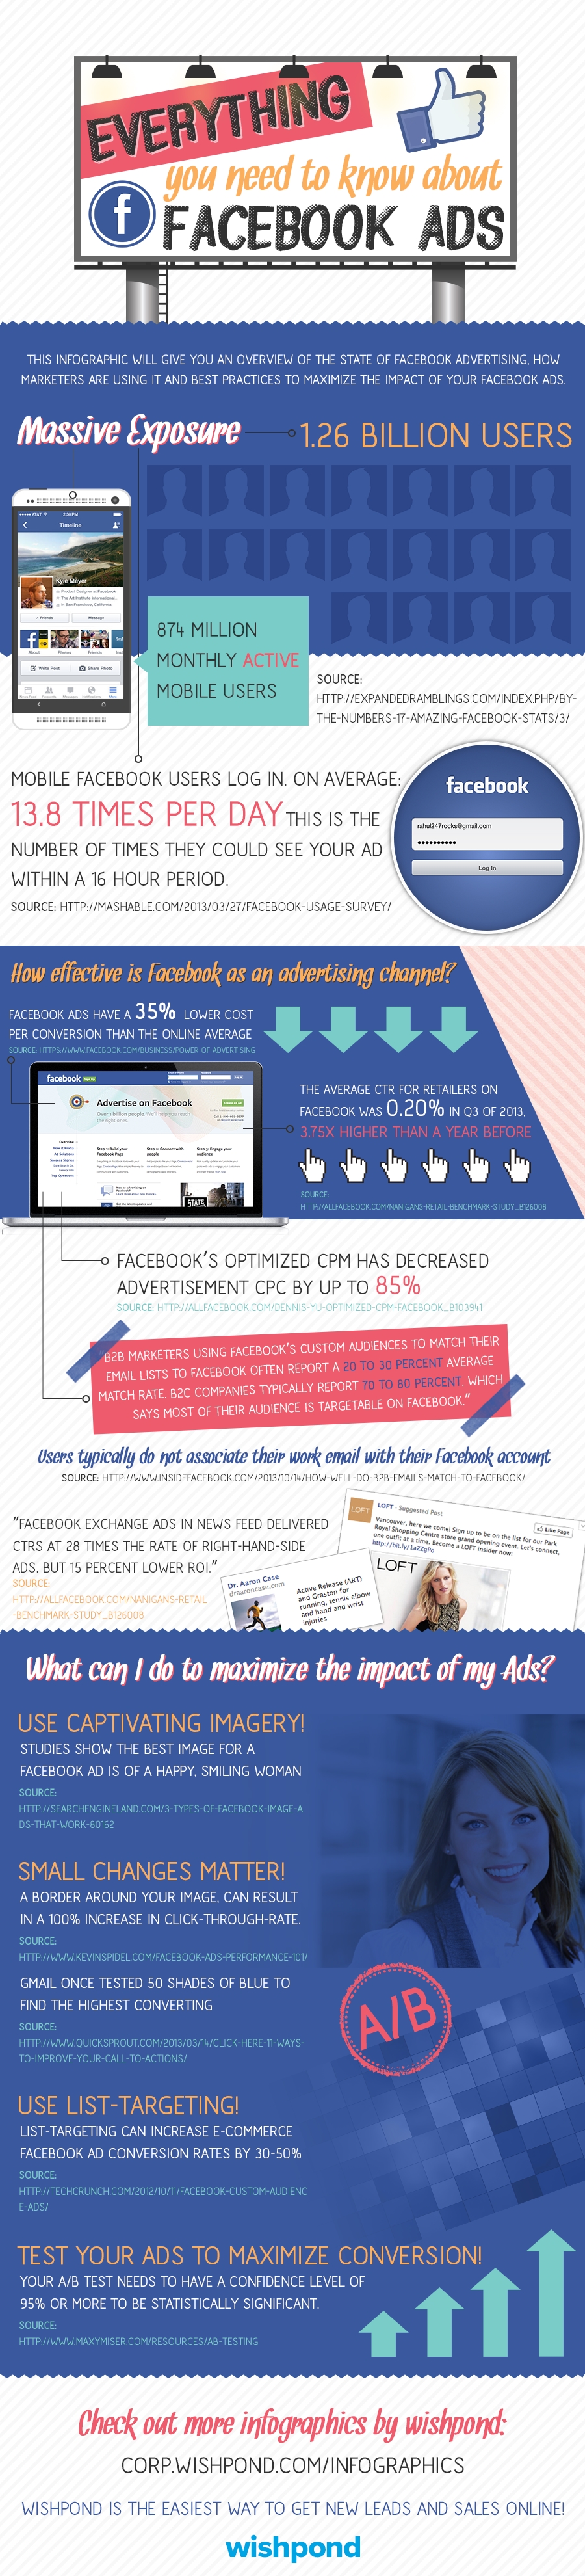
Marketers should conduct a research survey about their target customers and analyze all possible ad options on Facebook before investing in any particular ad-campaign. Social marketing company Wishpond has summarized all facts and figures related to advertising on the Facebook platform in an Infographic below.
Facebook has a massive user base of 1.26 billion of which 874 million operate using mobile devices. On an average, mobile Facebook users login at least 13.8 times a day.
Facebook ads have 35% lower cost per conversion than the online average. The CTR rate on an average for retailer was 0.20% in Q3,2013, which is 3.75X higher than a year before.
B2B marketers who try using Custom audience feature to match their email lists to Facebook, often reported a 20%-30% average match rate, whereas B2C firm saw a match rate of 70%-80%, proving the platform is more effective for B2C customer targeting. Facebook is also known to drive 77% of new customers to B2C firms.
Facebook exchange ads in the NewsFeed delivered a CTR 28 times the rate of right hand side ads, but, 15% lower ROI. Facebook’s optimized CPM has decreased advertisement CPC by up to 85%.
Marketers of brands should use captivating imagery for their posts (like that of a smiling woman) to drive more user engagement. Usage of rich media content like images, videos and infographic are always much more engaging than text messages.
List-targeting should be used as it can increase the e-commerce Facebook ad conversion rate by 30%-50%. Content must be well designed and informative, smartly embedded with the theme of a brand product. SlideShare and infograhpics must be increasingly used within the content to drive more engagement.
Pin-board style photo sharing website, Pinterest with more than 70 million users since its inception, is rolling out vast features to attract worldwide users and firms. A large number of brands are likely to adopt the Pinterest platform for effective marketing of their brands and boost their sales during the upcoming holiday shopping days (Cyber Monday, Small Business Saturday, Christmas). Pinterest has been rolling out various features like – related pins, holiday gift guide and a lot more to attract both users and advertisers to adopt the platform for effective brand engagement.
A Whopping 786% Increment Was Seen In Visits To The Pinterest Website In The Last 1 Year!
Images are a more convincing form of communication compared to text messages and Pinterest by its very nature of visual medium, attracts most of the users across the globe who love discussing and sharing messages pictorially. According to a survey which interviewed 7,431 online buyers from August 9-August 17 (2012), more and more online consumers agreed that Pinterest is a place to get inspiration on what to buy and help keep track of or collect things a user likes. This has greatly contributed to the website traffic of Pinterest which rose up from 901,761 in September 2011 to 7,985,316 in September 2012 (from the U.K only), an increase of 786%, making it one of the fastest growing websites on the planet. The U.S saw a 15 fold increase to 139 million visits in September 2012, compared to 9.2 million about a year prior to it.
Pinterest Introduces Holiday Gift Guide! Brand Sales Likely To Skyrocket In The Holiday Shopping Season!
Pinterest is a website that most of the users get totally immersed in, and end up spending hours together enjoying the soothing effect of images via pins. Marketers of various brands should be active on the Pinterest platform as more than 80% of content on the website consists of Re-pins, which means chances of getting free publicity by active participation of users are high. More than 70% of brand engagement on Pinterest is generated by users themselves without any promotion by brand owners. Pinterest recently introduced the holiday giving guideand holiday gifts feedto assist consumers in providing suggestions or guidance for buying gifts for their friends and peers in the prevailing shopping frenzy season.
This feature is likely to benefit those who find it difficult to shop for gift items, users can find more than 100 boards filled with ideas for those who wish to gift. Pinterest has also selected a handful of celebrities and notable Pinners to create holiday boards based on their area of expertise/knowledge. (Example – “Gourmet gifts for foodies” by Andrew Zimmern of Travel Channel’s Bizarre Foods, and “Gizmo gifts for geeks” by tech author and investor Guy Kawasaki). Users can also shop for specific items of retail brands via the gifts feed feature, in which users can sort the feed and browse products with filters like ”Gifts for kids”, ”Gifts for him” and ”Gifts for her”. Pinterest has also entered into partnership with Wallmart, Zappos, Disney and other retail brands, who now provide a fun browsing experience to their visitors by showcasing their visual content in a pin-board style.
Pinterest’s head of community marketing, Katie Garlinghouse, wrote in a blog post Wednesday – “In the spirit of the season of Pinspiration, we’re unveiling our first-ever Holiday Giving Guide. We asked some creative Pinners to share their favorite gift ideas to help you find the most imaginative gifts for every type of person on your list.”
According to a study by Convertro, Pinterest has taken the e-commerce arena by surprise, accounting for 17.64% of e-commerce revenue (in the U.S, April 2012) from social media sites. Pinterest shoppers in the U.S spend on an average $140-$180 whereas Facebook Inc. (NASDAQ:FB) and Twitter Inc. (NYSE:TWTR) shoppers spend $60-$80. Pinterest is known to drive 15% of shopping traffic to retail websites. Pinterest’s related pins are likely to act as an extra aid to drive referral traffic for e-commerce sites. According to a report by Shareholic, Pinterest has scaled up by 66.52% in referral traffic rate for websites, in last one year itself.
Pinterest’s viral nature can be best used by marketers to advertise their brands. Boards should be designed such that there is an optimum mixture of photographs, graphics and texts. Online shopping brands should pin images of their own products to their board, whenever users click on an image they will be directed to the brand’s website and this may lead to a purchase or engagement of some sort.
In Pinterest, marketers can explore through various boards, measure engagement across different product categories and promote offers and deals according to the engagement by users on a particular product category. Brands should design boards such that they are not purely self publicizing but are also informative and offer guidance on how all kinds of creative or practical things are done, smartly amalgamated with products or services of brands. User experience can be enhanced by cleverly binding the main theme of the brand’s product along with some attractive, entertaining content such that users feel like engaging and sharing with others. Rich Pins, Price alerts, Promoted pins can be best used for promotion or launch of a new product or event.
People love reading News prevailing around them along with a sip of coffee early morning or during their leisure hours. Landscape of news consumption by information seekers is continuously evolving from print media to television and now to the Internet on Smartphones and tablets. Recently, the mode of news consumption has taken a dramatic turn and shifted to social media sites as a majority of time spent by web users across the globe is on social media. The news channels have covered up (showcasing their presence) every single social networking platform available to provide the latest news to its viewers.
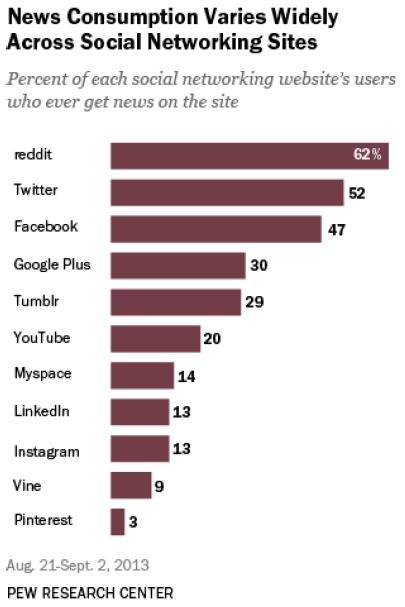
Reddit Is Leading With 62% Of Its Users Consuming News On Site, Followed By Twitter(52%) And Facebook(47%)!
According to a survey by Pew Research Center conducted between August 21 and September 2, 2013, among a nationally representative sample of 5,173 odd respondents (adults who are 18 years of age or older), Reddit emerged as the leading site with 62% of its website users consuming news on the site. Closely followed by Twitter Inc. (NYSE:TWTR) with 52% and Facebook Inc. (NASDAQ:FB) with 47% and Google Plus with 30%.
Reddit is the leading site preferred by users world-wide for news consumption, it’s success can be attributed to the algorithm upon which the whole system is built. News information all over the globe is continuously compiled and the Reddit users can voice their opinions through the Upvote system, and news with the highest votes is filtered out and given a higher preference. Hence the most relevant or important news which most of the users read can be viewed right at the top.
Twitter is undoubtedly the leading site when it comes to prevalence of news due its wild-fire nature with features like the retweet. Most of the world leaders, politicians and news channels use the platform for breaking news or the latest updates or their views and opinions pertaining to interesting areas to their followers. The increasing usage of mobile devices has promoted Twitter to the top due its uniqueness in adjusting well on the mobile platform which has encouraged more than 70% of its users to adopt mobile Twitter. Facebook is next in line after Twitter with 47% of its users consuming news form the site. Although, the major focus of Facebook users is networking with friends and close peers, the platform has evolved well for other activities like brand engagement, business related discussions, customer acquisition and news consumption. Technology powering Facebook mobile has revolutionized the experience of viewing Facebook updates on mobile screens, hence people love browsing the site for news consumption and other purposes at places of their comfort on Smartphones and tablets.
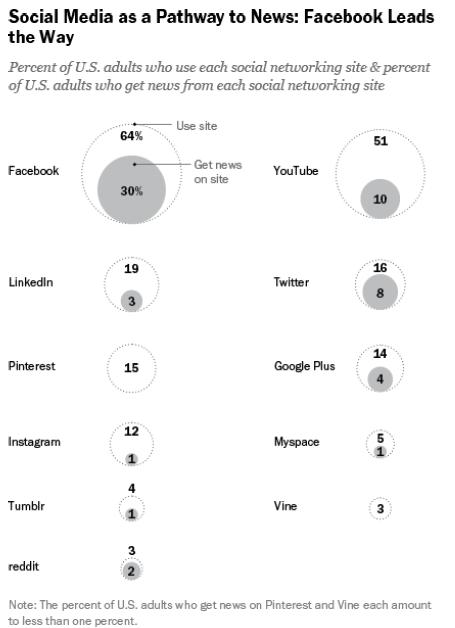
Facebook Is The Largest Social Media Network With 30% Of The U.S Adults Consuming News On The Site, Followed By YouTube – 10% & Twitter – 8%.
If we analyse news consumption by U.S adults, Facebook outplays the rest of social media by a large margin. More than 64% of the U.S adults use Facebook, as mentioned earlier 47% of Facebook users consume news, hence effectively 30.8% of the U.S adults consume news on Facebook. Next in line was the undisputed king of video content – YouTube, which is used by 51% of U.S. adults, and as only a fifth (20% – mentioned earlier) of its users get news there, that amounts to 10% of the U.S adult population consuming news on YouTube site. Micro-blogging site Twitter reaches just 16% of U.S. adults, but half (8% of U.S. adults) use it for news. Reddit is a news destination for nearly 62% of its users. But since just 3% of the U.S. population uses reddit, that translates to 2% of the population that gets news there.
Facebook is emerging as the complete package – providing its users with all possible features to suffice their daily needs. Right from networking with friends, chatting, promoting businesses, networking with employers, job acquisition, news consumption, acquiring customers for your firms, searching for top rated sight-seeing destinations, brand engagement, creating mass movements, social awareness pertaining to sensitive issues and a whole lot more. If Facebook developers are able to evolve the UI (or technology powering Facebook) in such a way that users are able to prioritize their news feed with content of their choice depending on their purpose of visiting the site – it will help them in promoting it as a daily-go-to website for users. Almost all the users are likely to have their browser home page as Facebook – if all their needs are available on a single website.
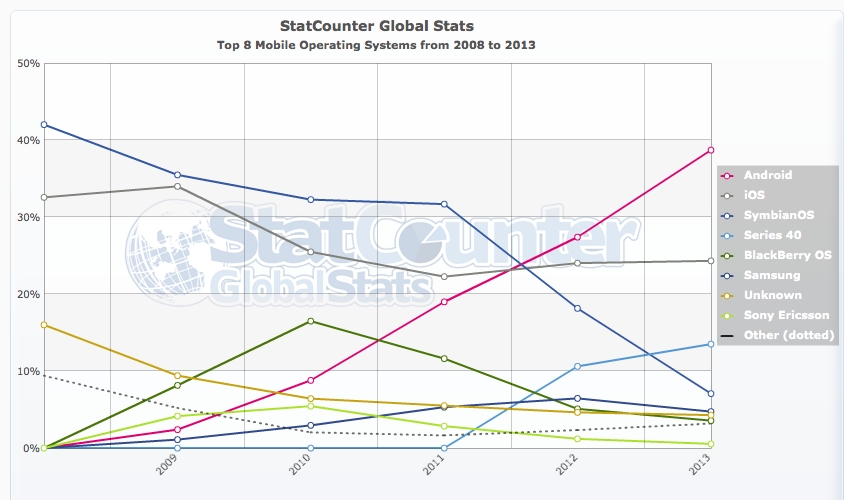
The rise of Android – a Smartphone operating system developed by Google Inc. (NASDAQ:GOOG) – is doing well, to say the least. Based on the Linux kernel and designed primarily for mobile computers such as tablets and smartphones, Android was initially released in the year 2008. It has steadily taken over the market ever since and is being used on smartphones and tablets that are manufactured by numerous vendors, including Samsung, Lenovo, LG, Sony, and HTC.
In Q3 2013, Android captured 81.9% of total Smartphone sales, outpacing iOS and Windows Phone OS by a distinct margin. Interestingly, Android and the late-entrant Windows Phone OS were the only ones that registered a positive Y-O-Y growth in Q3 this year.
Android In The Early Days
Android, Inc. was founded in October 2003, in Palo Alto, California. At the time, the intent was to focus on developing a smart operating system for digital cameras. The company operated secretly, not revealing anything more than the fact that they were working on software for a mobile operating system.
Android’s biggest rivals in those days were Symbian and Windows Mobile as Apple’s iOS hadn’t been launched back then. In the year 2005, Google acquired Android, which then became a wholly-owned subsidiary of Google.
With the launch of the Nexus series of devices in 2010, Android gained popularity as an operating system for smartphones and tablets. Since then, many new versions of the Nexus series have been launched, with the latest versions of the Android OS.
Android Started To Face Criticism
Despite the fact that Android has garnered phenomenal success in recent years, it has also faced severe criticism on various grounds. There have been many myths regarding its usage, while some of its features have been slammed by users and endorsers of rival operating systems such as Apple’s iOS and Windows Phone 8.
Android Is Complicated For New Users
One of the biggest myths surrounding the use of Android as a mobile operating system is the notion that it’s too complicated for a new user. This, however, is far from the truth, as Android is quite unlike any other mobile platform when it comes to ease of use.
Most Android users have previously been users of feature phones. The features on these phones are seemingly more accessible in comparison with that on Android. This is by far the only reason why Android is supposedly complicated.
On the contrary, Android is rather intuitive and makes it relatively easy, even for new users to avail of several benefits. With the Android tablet and Android mobile prices being well within the reach of even the low-income sections of society, a spike in popularity is evident, even among new users. It has been estimated that by 2017, nearly 50% of the Smartphone market would be occupied by low-cost Smartphones, with an average price of $200.
The Supposed Need For A Task-Killer On Android
Android has been facing a great deal of criticism by those who claim that the operating system is in urgent need of a task-killer. Users believe that a task-killer would help boost the performance of their device. As a result of this, countless users around the world have been downloading task-killers in an attempt to boost battery-life and get more out of their devices.
However, some have found that using a task-killer slows the performance of their device to some extent. In fact, deleting these task-killer apps helped their phones run much faster. The battery life and the stability of such phones depicted a positive trend when a task-killer wasn’t used.
The Threat Of Malware
In 2012, 32.8 million Android devices were found infected from malware, a majority of them were targeted by app repackaging, malicious URL and Smishing. Many people are of the opinion that Android apps can come infected with malicious software. However, this is far from the truth. The average user can safely use Android if he refrains from installing apps from third party sites.
Only when users install third-party apps do they face disastrous consequences.
A useful feature on the Android OS is that the apps ask you for permissions before they’re installed. This helps you monitor whatever is being installed on your phone, and helps keep malware threats at bay.
Android Is Monotonous?
Android has been slammed by many who think that the operating system looks and feels the same, irrespective of the device it’s running on.
There are various devices in the market that have the Android OS running on them but the OS does suffer from certain limitations. These devices can barely be called Android devices. What matters is that you check the specifications on an Android device before purchasing one.
Frequent App Crashes?
Another reason why Android attracted criticism is that apps crashed more often on this operating system compared to others. There’s often a constant complaint that Android apps crash repeatedly.
This may not, however, be entirely true. Every newly-updated operating system faces such issues, while app developers try to tackle these issues. Once they are resolved, the platform gets right back on track, be it Android, Windows 8, or even iOS for that matter.
Android In The Year 2013
In the current year, Android has been seeing a remarkable surge in sales. This has been attributed to a number of factors. The primary reason for Android’s success is the fact that it is very slick in its appearance and sharp in its working. This gives it a huge advantage, even over rival operating systems such as the iOS 7.
On Android, You Can Use Widgets!
Android allows its users to have widgets on the home screen. Widgets are extremely helpful as they make important apps easily accessible. The fact that other operating systems don’t have this facility gives Android an upper hand. From weather reports to emails, traffic information and news, you can have widgets for just about anything that matters to you.
The Latest : Google Now
The latest feature on Android devices is the Google Now widget, which is able to read and predict which apps the user uses the most. It then displays the necessary information in the form of ‘cards’. Even though this feature is available on Apple’s iOS 7, it is best suited to Android.
Android In The Future
Looking at the current scenario, it’s quite evident that Android is the dominant platform when it comes to mobile devices. With Android mobile prices and Android tablet prices being rather flexible, these devices can be purchased and used by people belonging to almost every strata of the society.
With the slickness and simplistic usage that this operating system offers, it’s highly likely that Android will have a strong hold over the mobile computing market, even in the near future. As on October 2013, Google Android is enjoying 39.35% of total mobile OS market – the largest pie. While Android is strengthening its position in the market, arch rival iOS’ is losing its strong hold over the global mobile market.
As Android developers keep releasing new and interesting updates, the consumers definitely aren’t complaining.
Marketers across the globe now have access to an infinite number of options for advertising their brands to the masses. The online advertising industry is growing at a faster rate than ever before. A majority of advertising techniques are driving significant returns to brands provided they have properly analyzed their market potential and have a set of clearly defined target audiences. Social ads, exchanges, networks and portal ads are increasingly used by marketers but it is vital for marketers to have a clear picture about cross-channel visibility, actionable insights and real-time information across various platforms mentioned above so that they can target, engage and measure all aspects of their online media campaigns.
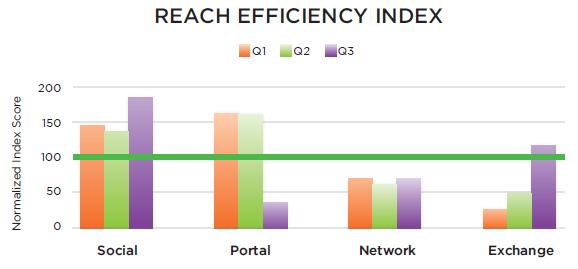
Social Networks Have More Outreach Than Ad exchanges! Portal Ads Record The Lowest Visibility Rate!
According to the Neustar Aggregate Knowledge Global Media Intelligence Report, which conducted a detailed analysis across 140 billion ad events, 60 billion impressions, and 32 million conversions in Q3, 2013, it was found that social networks were 58% more efficient than ad exchanges and delivered quality users who can drive business to brands. Exchange ads were next in line with an outreach index in the range of 100-150, followed by network ads with an outreach index in the 50-100 range and lastly portal ads with lowest audience reach index. Marketers looking to advertise their brands and attract new customers should focus on allocating a major share of advertising investment on social networks like Facebook Inc. (NASDAQ:FB), Twitter Inc. (NYSE:TWTR) and LinkedIn Corp (NYSELNKD). A majority of brands have realized that it is important to showcase their presence on social networks as it is the place where a majority of customers reside online. Facebook has over 1.189 billion monthly active users, Twitter has about 232 million active user and LinkedIn over 259 million users, brands should focus on making best use of such a massive active user base of these social media giants. As a result, portal ads are losing importance. The majority of time spent by web users on desktop or mobiles is on social networking sites or messaging apps.
Marketers should go by the prevailing trend and spend more time on performing cross-channel analysis and invest marketing budget accordingly. Social media advertising is the go-to option for marketers of various brands, they should focus on utilizing various channels available and market their well designed attractive content (with rich media) effectively to customers. An equal attention must be paid to designing effective content, discover various content marketing channels, analyze returns from different advertising techniques available, allotting the marketing budget based on research analysis performed prior to investment, conduct periodic assessment of ad-performance and the modify strategy if required.
Neustar Vice President of Marketing Solutions David Jakubowski said, ”The report demonstrates the huge opportunities that exist for marketers and brands across several verticals. The value marketers are getting from defining target audiences and reaching them with the right message is driving huge increases in campaign effectiveness and return on marketing investment, which hasn’t been possible before.”
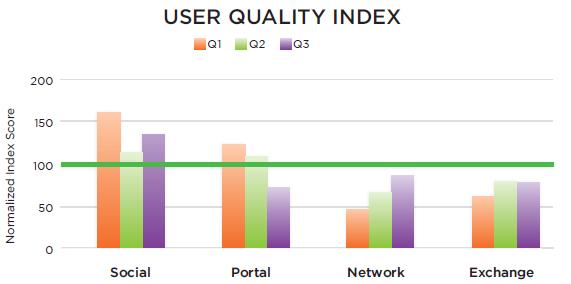
Social Networks Lead In Driving High-Quality Users To Marketers!
There are various modes of advertising which can drive countless ad impressions and persuade more than thousands of users to visit a brand’s website. But it is hardly of any use if the heavy traffic achieved through various ad-campaigns is not converted into sales. It is vital for any marketer to drive useful traffic to his or her brand’s website. They should adopt platforms which are known to drive quality users who can, in turn, drive business for the firm through the engagement of the required form (sales, shop, sign-ups). Delivering quality users should be the next important focus for marketers after improving the out-reach efficiency.
According to the graph above, social networks emerged as the top most platform in driving high quality users with above average user-quality index in Q3 of 2013. Networks ads, Exchange ads and Portal ads were next in line but all of them performed below the expected average user-quality index.
Social networking giants have adjusted pretty well to the sophisticated demands of marketers and evolved themselves effectively to innovate more specific ad-campaigns which can help derive maximum ROI for brands. Facebook recently introduced gender based ad targeting for brands with products which are specific to a particular sex. They have also introduced a location-based ad-targeting and Custom audience feature for local firms or SMBs whose services are limited to a certain geography. There has been over 75% increment in usage for the custom audience feature as more than 50% of the AdAge 100, use Custom Audiences in their campaigns to re-target their existing customers as they are well acquainted with brand names and other features and might opt to engage again with the brand.
People love engaging with brands on social networking sites. On an average a Facebook user likes 80 brand pages. People love discussing with their friends and like-minded folks about their favorite brands and share their experiences with them. Facebook also drives a majority of referral traffic to retail sites. Social networking sites have also adjusted well to the increasing usage of their services on the mobile platform. Users are increasingly browsing social networking sites like Facebook and Twitter though smartphone and tablets. These sites have evolved significantly to provide a uniform experience to users who wish to engage with their favorite brands on mobile phones and tablets.
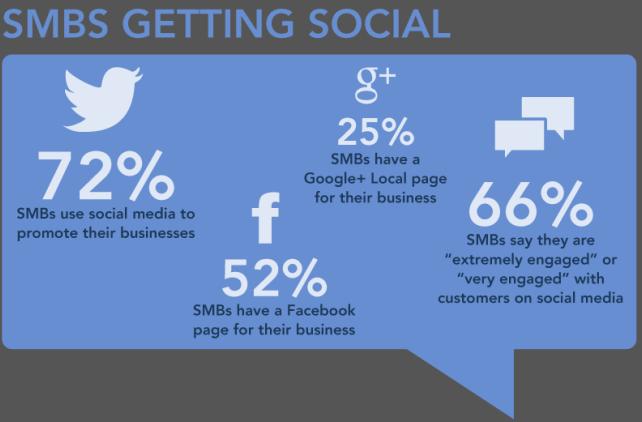
Social media sites have revolutionized the communication format followed by top firms and SMBs to interact with their customers or clients. Earlier a majority of SMBs were against the idea of using social media networks as they hardly derived significant ROI through social media activities. But continuous introduction of advertiser friendly changes brought about by Facebook Inc. (NASDAQ:FB), Twitter Inc. (NYSE:TWTR), LinkedIn Corp. (NYSE:LNKD) and Google Plus has compelled quite a significant number of SMBs to switch to the social media platform in order to interact with customers and also for branding purposes. Social media can provide SMBs with an immediate and interactive connection with their customers. Nearly 72% of SMBs now use the social media platform to interact, advertise, brand and discuss business.
66% Of SMBs Claim To Be Very Engaged With Customers On Social Media Platforms
According to BIA/Kelsey’s annual Local Commerce Monitor (LCM) survey on advertising and marketing of small and medium businesses (SMBs), nearly 66% of respondents claimed to be ”extremely engaged” with customers on social media. Nearly 52.1% of respondents were found to own a Facebook page for advertising and promotion purposes, while the LinkedIn platform was preferred by 28% of them, followed by video on websites by 26.1%, Google Plus by 25% and Twitter by 24.3%.
Due to continuous innovations in the field of advertising for local brands and small firms, SMBs are increasingly focusing towards Facebook, Google Plus and other networking sites. Few initiatives which are bound to prove effective for SMBs and local firms are summarized below.
Social Media Initiatives For SMBs and Local Markets!
Facebook recently introduced the custom audience feature, which is best suited to small and medium size businesses, as their customer base is very niche and concentrated over certain coverage areas. Owners of small scale firms or brands have their services limited to certain geographies, hence they prefer advertising to only those customers within an area limit who have had done business with them before. By using the custom audience feature, owners can place Ads or send promotional offers and deals only to those customers (through their phone numbers, email identities or Facebook identities) who were associated with the firm before. This is because they are likely to welcome the deals on offer. Usage of custom audiences has increased by 75% between Q2 and Q3,2013. Thousands of advertisers and more than 50% of the AdAge 100, use Custom Audiences in their campaigns as chances of engagement are higher from the existing customer base whenever a new product is launched.
Facebook had recently introduced the reviews feature, which is similar to the City expert program by search giant, Google Inc. (NASDAQ:GOOG), to help local businesses, as the reviews provided by people could be viewed by other users on the web and it acts as good publicity for high rated pages. Low rated pages can learn from the detailed reviews provided by consumers and modify their business strategy to compete with rival brands. Facebook had also introduced location-based Ad targeting which is likely to benefit small and medium scale firms who are focusing on customers of a particular demography. The Preferred Marketing Developers program (PMD) is yet another move where developer and marketers of SMBs can work together and devise a strategy to attract customers of their liking.
SMBs belonging to the B2B arena, can use the LinkedIn platform effectively as it is known to drive a majority of traffic to B2B websites. B2C firms can rely more on Facebook as the platform helps them acquire more than 77% new customers. Google’s humming bird update is likely to boost search rankings for small and medium scale firms who didn’t show great results for generic terms earlier. Firms should update their website content and try inculcating key words within the content, which users generally use while searching. It is vital for SMBs to prioritize content writing as one of the main business objectives.
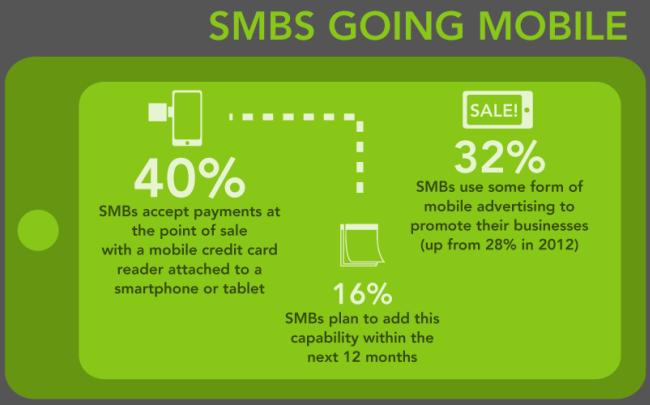
Small And Medium Businesses To Adopt The Go-Mobile Strategy
The fast-growing mobile and internet sector has changed the way small and medium business firms operate. With the increasing usage of Smartphone and tablets, business firms are forced to revise their websites to ensure that they are well-suited both for mobile and tablet screens, so that customer-experience is remains uniform all along. Online stores which come under SMBs (if their coverage area is limited to a particular region or state) should adopt the mobile first strategy so that consumers are able to browse through products comfortably and shop online. Currently, more than 40% of SMBs accept payment at the point of sale with a mobile credit card reader attached to a Smartphone or a tablet. Additionally, 16% of SMBs are planning to add this feature in next one year.
Nearly 32% of SMBs use some form of mobile advertising to promote their businesses. The mobile strategy is the major channel for commerce in the future. Mobile adoption is quite decisive for a firm’s success as the users across the globe are consuming a majority of digital content through mobile devices.
If we compare social media, Facebook recorded 253% surge in mobile referral rate to websites, hence SMBs using the Facebook platform can expect a whole lot of benefit by adopting the mobile first strategy. Micro-blogging site Twitter which is best suited for mobile screens can act as a powerful tool for small and medium scale firms when it comes to branding.
The world’s largest micro-blogging site Twitter Inc. (NYSE:TWTR) made a sparkling start at silicon-valley’s most awaited IPO in years, converting a majority of investors into millionaires overnight. The original share price of $26, rose up by a whopping 73% on the opening day and rested at $44.10 (with a peak price of $50 during the course of the day) on day one. Currently, Twitter is being treated like an ever-growing stock even though its share price has dropped to $40.18, hardly any investors are worried due to its rich potential for growth in the next couple of years.
Nearly 1600 Employees Turned Into Instant Millionaires!
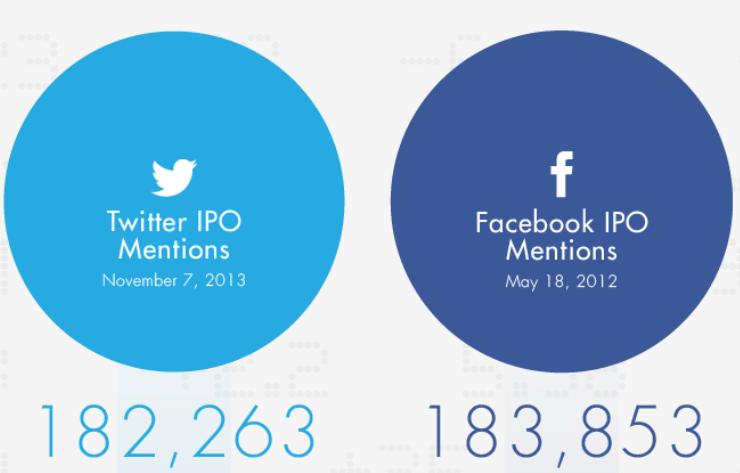
Micro-blogging site, Twitter is a small company when compared to social media titan Facebook Inc. (NASDAQ:FB), but the amount of cash pumped into it and the hype surrounding its growth has reached an all new level. A majority of investors are excited about the San Francisco based firm, which has turned some 1,600 odd Twitter employees into millionaires or better. The social buzz around Twitter’s IPO was much higher and if we compared the same with Facebook’s IPO, figures are somewhat similar.
Twitter’s monthly active user base is a mere 232 million when compared to Facebook’s 1.189 billion monthly active users. In spite of that the discussion surrounding the Twitter IPO was pretty chaotic, to say the least. Twitter’s IPO garnered 182,263 mentions on the internet, 94% of which were on its own platform, whereas Facebook IPO had seen around 183,853 mentions on its IPO day (May 18, 2012), interestingly 89% of them were recorded on the Twitter platform. This shows how the 140 character powered service has revolutionized the way people communicate.
A couple of reasons which can be attributed to the hype around Twitter’s growth potential are – an increasing usage of Smartphone, accelerating internet penetration rate, the mobile first strategy of Twitter, an ever-growing revenue and various initiatives taken to attract advertisers. With a growing demand for rich media content, Twitter revised its timeline by allowing images and videos to be displayed right below the tweet, visual tweets drive 150% more re-tweets and benefit brands. Twitter is trying to invest more on developing new initiatives and the R&D part, as their main focus is to attract more retail companies.
Twitter’s Share Price Expected To Dive In The Next 6 Months!
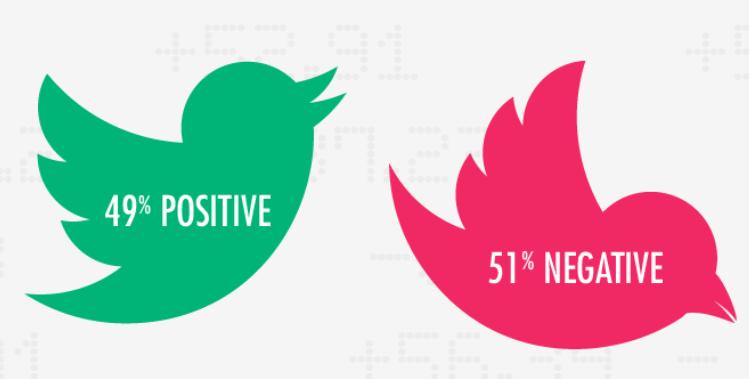
Twitter received a blistering start at the New York Stock Exchange. Although there are numerous discussions pertaining to the IPO on the internet, but more than 51% of them are negative are sceptical of Twitter’s growth potential when compared to the hype it has generated.
According to a recent poll by Bloomberg, which interviewed 750 customers and discovered that more than two-thirds (68%) were sceptical about Twitter’ growth in the next 6 months and predicted a possibility of the stock price falling well below the $44.90 per share mark. Hardly 12% of ambitious voters predicted that the share price will increase beyond $44.90 and another 12% were clueless about the future trend. About 82% of respondents thought the Internet and social-networking stocks were either in a bubble or nearing one.
Some analysts have rated Twitter as a sell-out, citing concerns that user growth maybe limited when compared with rival social networks like Facebook or LinkedIn Corp (NYSE:LNKD). Investors who are well acquainted with share market also challenged that TWTR shares will fall below $28 by June.
Everyone is aware of the fact that Twitter is not yet profitable, its loss rate is on the rise with each passing quarter. Twitter had earlier revealed a net loss in Q2, 2013 of 42 million, which rose up by 153.8% in Q3,2013, recording an epic loss of 64.6 million. Twitter has 2,300 employees and the investment in providing them with a competitive pay and R&D is exceedingly high. Close to $30 million is being spent in stock offerings to its employees. Although Twitter has its own enriched customs and traditions, hardly 15.4% of Twitter’s registered users bother to tweet regularly. A majority of them register and end up joining a set of passive, non-tweeting users who account for 764.784 million of the total registered user base. Its arch rival, Facebook, which is booming with hefty revenues, is proving tough competition for Twitter right now.
It would be too early to say that the share prices might dive or rise on a long-term basis as there are mixed opinions regarding its growth potential. We might not get to see huge boom (for the next few months) in share prices, like it was after the IPO launch. A safe conclusion to arrive at would be that share prices might not go beyond $44.90 in the next 6 months. But one might be more interested in knowing the value of the TWTR share about 12-18 months from now.
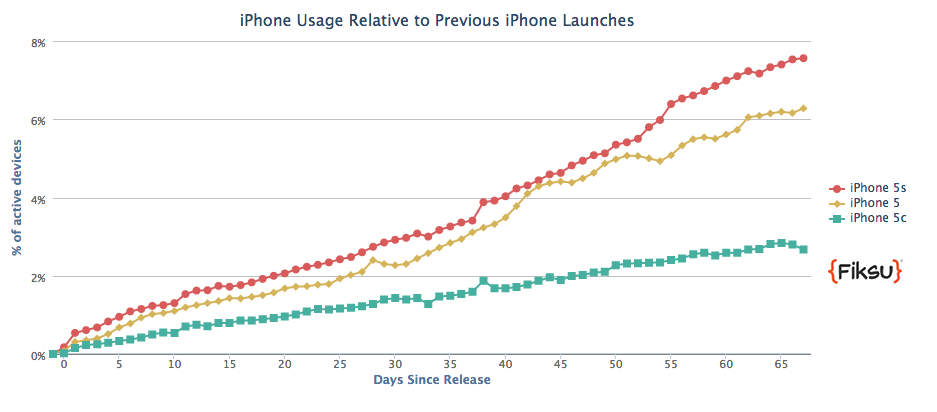
In the last few weeks Apple Inc. (NASDAQ: AAPL) has recorded an improvement in sales figures of the recently introduced iPhone 5S. Surprisingly, the adoption rate for the iPhone 5S is faster than its predecessor iPhone 5 in the first 66 days since launch.
According to the latest report from Fiksu that tracks its Software Development Kits (SDK) being used on an individual iPhone, the iPhone 5S has already captured 7.6% of the total iPhone market within a short span of 2 months since launch. Comparatively, the Apple iPhone 5 was enjoying 6.6% market share in the same duration since launch, last year. The growth has mainly been reported due to less number of manufacturing issues compare to the iPhone 5, claims the report.
Both the iPhone 5S and the iPhone 5C went on sales from September 18, 2013 and since then Fiksu has been tracking the growth of all variants of the iPhone.
Since the introduction of new iPhones, iPhone 4S has lost sizable market compare to other variants.; the markets share of iPhone 4S dived to 28.9% from 33.5% on the launch day of iPhone 5S. Similar trend is also recorded in the iPhone4 market share. However, iPhone 5 hasn’t been affected much from the launch of its successor and recorded a negligible loss of 0.3% in its market share to iPhone 5S in last 66 days.
The report also highlights the disappointing show of the iPhone 5C that failed to lure users. While Apple was keeping high-hopes from its low-priced iPhone model, people are yet to show confidence in the iPhone 5C. Since launch, the iPhone 5C has managed to grab only 2.7% of the total iPhone market.
The declining trend in the market share of iPhone 4S and iPhone 4s is bound to grow after recent introduction of trade-in program that allows iPhone 4 and iPhone 4S users to grab minimum 13K discount to iPhone 5C and iPhone 5S.
It would be interesting to see what strategy Apple applies to boost the sales of iPhone 5S and iPhone 5C, especially when rumor mills have announced the launch of bigger screen iPhone 6 in April-May next year.
With the shopping season approaching closer, consumers are enthusiastic and are planning their holiday shopping schedule, at the same time the U.S companies are gearing up for some epic shopping deals and offering various incentives to attract shopaholics. A majority of retailers are placing offers based on requirements or interest of consumers – discount offers, free gifts, loyalty programs, an increased warranty and service period are among the few. As social media, internet and Smartphone penetration is increasing day-by-day, most of the shoppers are spending more time-consuming digital media to plan for their holiday shopping season. Accordingly, brand owners and retailers are pacing out various attractive advertisements, mobile apps and mobile strategies to grab a major share of total online shopping sales.
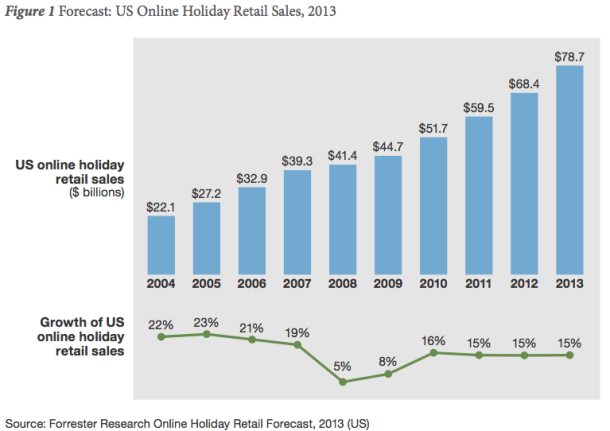
As Cyber Monday is just a week away, marketing analyst have started predicting various figures about this year’s total shopping sales to provide better insights to retailers for planning their advertising and marketing budgets. According to the market research company Forrester, a record $78.7 billion, an up surge by 15% compared to 2012, will be spent in U.S. online shopping this holiday season. Approximately 167 million shoppers are expected to sit back at home and shop online through their Smartphone and tablets, on an average, an individual shopper will shop for around $472. The above figures are predicted by taking into account Black Friday, Cyber Monday, Thanksgiving day, Christmas and Post-Christmas period, including sales through Smartphones and tablets.
A majority of marketers are busy using various channels to reach their customers and be the first one to provide them with the most exclusive and best offers. More than 48% of shopaholics prefer social media for planning their holiday shopping schedule. Facebook Inc. (NASDAQ:FB) recently in its blog entitled ‘Tis the season to go mobile’ listed numerous options for marketers to use the platform and address its massive crowd of 1.189 billion.
“Strong economic growth and low unemployment rates project a healthy playing field for online holiday sales and outweigh any lingering dampening effect of the government shutdown. This strength is even more evident online than it is offline, as consumers continue to shift their spending to multiple digital devices from stores.” Forrester analyst Sucharita Mulpuru wrote in the report.
Optimized News Feed And Devised Mobile App Ads To Target Customers!
Facebook saw a spike of a whopping 253% in driving mobile referral traffic to retail sites, which is why a majority of brands advertising on Facebook should adopt the mobile first strategy. Their websites should be optimized well for customers to shop comfortably on Smartphones or tablet devices. Marketers should try to optimize the news feed to grab the customer’s attention, as the posts on mobile Facebook generally have a higher level of engagement, inclusion of rich media content like images, videos and infographic are likely to be engaging for users. Users generally love to browse through video content, hence a video ad of 30-60 secs in the mobile news feed can be effective in engaging users and persuading them to buy products online.
Marketers should understand the requirements or needs of consumers and devise a strategy accordingly. More than 76% of North Americans prefer retailers providing the loyalty program. Brands must focus on framing attractive deals and offers like free shipping, discounted rates, free products as gifts or extended warranty periods as part of the loyalty program. Servicing of products during the post-purchase period must be availed for longer periods to attract smart shoppers who often go around showrooming.
In 2013, thousands of businesses have devised Facebook mobile app ads to drive more than 145 million installs from Apple’s App Store and Google Play. Mobile app ads are vital in driving user engagement as loyal brand fans prefer browsing for the required products on their favorite brand through personalized brand apps. It is important for retail brands to promote various exciting deliverables to customers through exciting apps.
Retail brands can notify their existing loyal fan base about their holiday sales or promotion through the mobile app. They can avail special discounts or shopping hours for consumers shopping through the mobile app. Gamification and a music app (with new holiday-themed playlists) can boost the engagement rate and attract more consumers to buy products through online shopping. Incentives like free shipping, special discounts , extended service periods must be provided for existing customers to promote a long-term association.
Re-targeting The existing Customer Base Through The Custom Audience feature And Attracting New Ones Through Facebook Advertising!
Facebook had recently introduced ‘Custom audience’ , using which brands and marketers can target their existing customer base using their contact details like their Facebook identities, email identities or phone numbers. Thousands of advertisers, including more than 50% of the AdAge 100, use Custom Audiences in their campaigns as existing customers are most likely to re-engage with the brand when a product is launched (provided their past experience was positive). Between Q2 and Q3 2013, there’s been an almost 75% increase in the number of marketers using Custom Audiences in their ad campaigns, especially brands with niche audience groups favor the Custom Audience feature the most. Retail brands can promote sales or offers of holiday season through this feature, as existing customers who have had a good experience with the brand are likely to be loyal and welcome a good deal or gift idea promoted by the brand.
Retailers can also acquire new customers by excluding existing customers (if they have their contact database) from their Ad campaigns. Features like location-based Ad-targeting, gender based Ad-campaigns or advertising based on Age-group are a few other options which can be used well by marketers to grab attention this holiday shopping season.
A majority of upcoming brands across the globe invest heavily in advertisements, operations, marketing and other business segments expecting flourishing results on long-term basis. But, few countable ones spend time and money in analyzing or studying the consumer behavior, economic conditions, buying power or market potential of a particular demography. It is important for marketers or brand owners to conduct deep analysis or research before launching or expanding their business to a new demography.
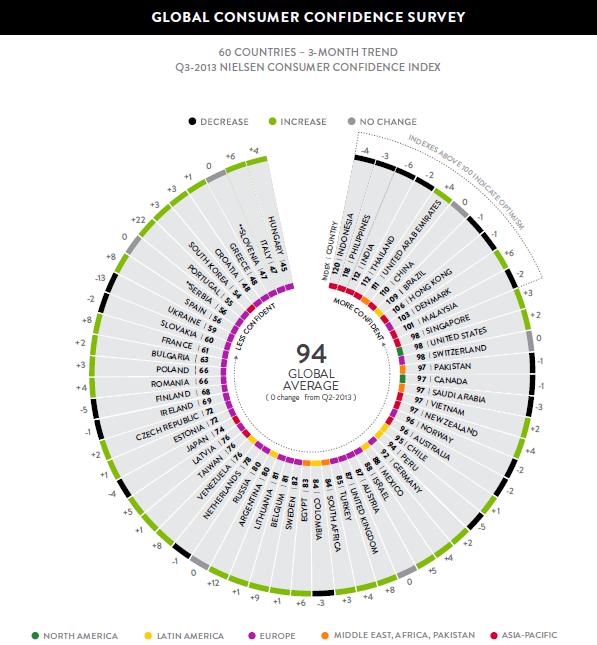
The Nielsen Global Survey of Consumer Confidence and Spending Intentions, measures consumer confidence, major concerns and spending intentions among more than 30,000 respondents with Internet access in 60 countries. Consumer confidence levels above and below a baseline of 100, indicates degrees of optimism and pessimism. The Nielsen consumer confidence index measures perceptions of local job prospects, personal finances and immediate spending intentions.
The latest round of the survey conducted between August 14 and September 6, 2013, consumer confidence factor increased by nearly 57% of markets measured under the survey, compared to 45% in the previous quarter.
Global consumer confidence index (CCI) factor in the third quarter of 2013 rested at 94, without any significant change when compared to Q2 of 2013.
Indonesia emerged as the topmost country with highest consumer confidence index factor of 120, followed by Philippines (118) and India (112). Top five countries with highest consumer confidence index were from the Asia-Pacific. Hungary reported the lowest consumer confidence index (CCI) of 45, but posted a 4 point increase from Q2. Although a majority of Asia-Pacific nations were at the top of the CCI list, the observed growth rate was negative in most of the cases. Whereas the developed economies saw an enormous growth in CCI rates. Portugal reported the biggest Q-O-Q growth rate of 22 points and the overall score rested at 55.
Although the CCI factors across various economies showed a diversified observation, discretionary spending intentions increased by an average of 5% across all categories measured in Q3 compared to Q2,2013. Nearly 38% of them upheld intentions to spend savings on buying new clothes(38%), spend on holidays/vacations was supported by 38% of respondents. About 35% preferred out-of-home entertainment and close to 25% of them decided to invest on home improvements. Intentions to buy new technology products (29%) increased 4 percentage points compared to Q2,2013.
Consumer Confidence In Asia-Pacific Declines, But Spending Intentions Increase!
Although the top few nations in CCI rating list belonged to the Asia-Pacific, confidence in these key developing economies continued to show a declining growth rate on Q-O-Q basis. Indonesia, in spite of being the topmost in rankings recorded a decrease by 4 index points, Philippines decreased by 3, India by 6 and Thailand by 2 points compared to the previous quarter. China and Russia both held steady from their Q2 2013 scores of 110 and 80, respectively. 8 of the 14 countries measured in the region posted a decreasing consumer confidence index rate.
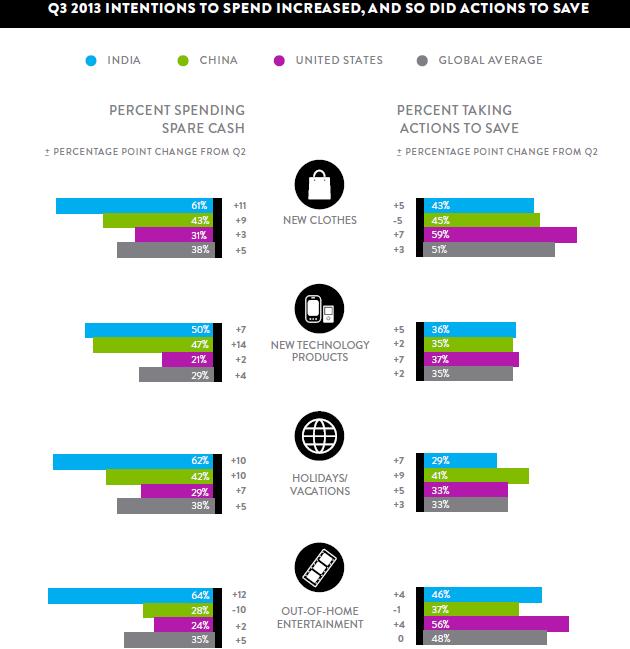
An intention to spend was most evident in the Asia-Pacific and North America, where discretionary spending intentions increased across all categories. On an average a 7% increment compared to Q2,2013 was observed in investment on luxuries like new clothes, out-of-home entertainment and new technology products. If we analyse the graph below, nearly 61% (up by 11%) and 43% (up by 9%) of respondents from India and China respectively preferred spending spare cash on new clothes (both are well above par from the global average of 38%), whereas about 43% of Indians and 45% of Chinese folks were price sensitive when it came to buying of clothes. Shopping trends in other categories like investment in new technology products, holiday outings, out-of-home entertainment were somewhat similar.
Consumers from developing economies generally avoid switching brands and are more price sensitive. Nearly 92% of folks from emerging markets prefer retailers offering loyalty programs and extra incentives like free shipping, free products, discount offers. Retailers should design an optimum strategy to drive sales in developing markets of Asia-Pacific, extra incentives must be added to attract shoppers. Another important addition – availing a service guarantee for extended periods to attract money-minded customers who practice ‘showrooming’.
“The devaluation of the Indian rupee, the decreasing GDP, and negative news coverage on the economy has most probably contributed vastly to the low levels of confidence for consumers in India in the third quarter. However, consumers are still willing to spend more in the festival season. Festival time involves high consumption on travel, gifts, new clothes and entertaining. Although consumers are acutely aware of the economic pressures, manufacturers and retailers activate deals and discounts during this festive time period to give consumers more value for the money, which helps to ease their spending concerns,” said Piyush Mathur, president, Nielsen India.
Now, let us analyse the trend in the developed economies of North America. The CCI factor in the U.S recorded an increase of 2 points and rested at 98, an increase of 8 index points compared to its figure in the same quarter a year ago. Conversely, confidence factor in Canada reported a negative trend with 2 consecutive quarters of decline, from an index of 102 in Q1 to 98 in Q2 and then a further decline to 97 in Q3.
The growing positive consumer confidence sentiment in the Unites States was reflected in American’s increased spending intentions. Investment on home improvement projects increased to 24% (up by 8%), followed by holiday and vacations planning to 29% (up by 7%), purchase of clothes recorded a tally of 31% (up by 3%), out-of-home entertainment increased to 24% (up by 2%) and new technology products by 21% (up by 2%). A significant upsurge was observed in consumer groups who tend to save cash while purchasing products of the above mentioned categories. About 59% of folks (an increment of 7%) investing in new clothes preferred saving cash by opting for lower priced brands, nearly 37% (an increment of 7%) of new technology products users were price sensitive and 33% of travelers opted for low-cost tourist agencies.
It is important for brand retailers to provide exciting offers to consumers from the developed economies as more than 76% of them expect various incentives through exciting loyalty programs. Although a majority of customers in the region are economically strong, more than 61% of North Americans are price conscious. Cost of the products in these countries are much higher, it is important for retail brands to grab attention of customers by adding a few extra additives like free shipping or discounted prices.
“With U.S. inflation in check, confidence is now at the highest levels since 2007 giving consumers enough tailwinds to keep momentum moving forward, which may bode well for the upcoming holiday season. Fast-moving consumer goods dollar sales are up 2.1 percent year to date, and unit sales reversed a negative trend, now up 0.4 percent. However, residual effects from the government shutdown, debt ceiling, an uneven recovery, and the overall uncertainty that permeates the consumer mindset will likely curtail robust gains in sales.” said James Russo, senior vice president, Global Consumer Insights, Nielsen
Top brands looking to take their business to new heights should conduct a detailed analysis before venturing into that realm with any form of investment. Proper analysis of buying behavior, economic conditions and CCI factors must be conducted before forming any strategies about a product launch. Effective mobile strategy is required, as Smartphone penetration in the U.S and also in the rest of world is continuously on the rise. A Timely reply to queries and 24 hours of customer service must be the prime objective of every brand.
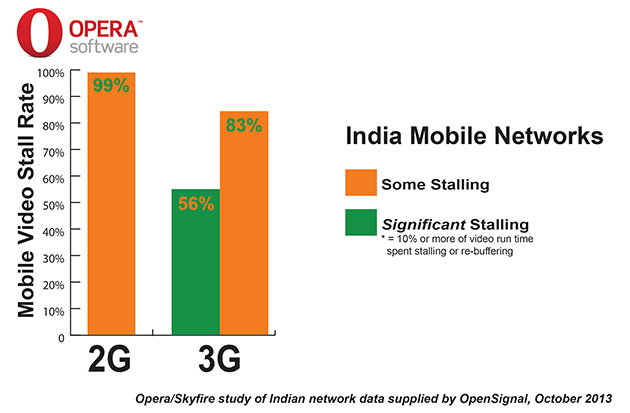
Mobile is the future and video content will continue to drive the growth of online publishing markets worldwide. Yet, in spite of this, Indian mobile data network providers are failing to scale up and can’t seem to beat, the minimum infrastructure required for an uninterrupted video consumption of 3G networks. It’s an apathy to learn that 56% of mobile video consumers on 3G networks in India face significant stalling and re-buffering, resulting in frustration and are frequently abandoned. The disappointment is vexed further when we see that the figure surges up to 89% after adding video users who experience some stalling on 3G networks.
According to a recent report from Skyfire – a cloud base mobile-video optimization player and a fully owned subsidiary of Opera Software – 40% of all video streams on 3G networks in India ran at a lethargic 300 kpbs bitrates. This is much lower than the actual needed bitrates required for running a HD video and the immensely popular Vine and Instgram auto-play videos that need anything between 900 kpbs and 1200 kpbs bitrates to run successfully.
The study defines Significant Stalling when the video consumed is more than 10% of its overall playtime in buffering.
The findings are really disappointing in the light of the fact that India will play a crucial role in global m-commerce by 2017. The contribution of Smartphone by India to global market is still low (2.1%), though the number of Internet enabled Smartphones are estimated to reach 264 million by 2016.
But that’s not all to justify the intense growth of mobile video users. Cisco’s Visual Networking Index 2013 estimates that mobile data traffic will reach a whopping 900 Petabytes each month by 2017, mobile videos would contribute to about 60% of this consumption. Besides, YouTube, world’s second largest search engine and by far the biggest the most popular video sharing site in India, has claimed that 50% of all YouTube video consumption in India were already being watched on mobile.
The damages from poor mobile infrastructure are not limited only to video consumption. Mobile shopping, mobile traffic monetization and real-time targeted mobile advertising are a few other areas that are attracting losses. In Asia-Pacific alone, India lags much behind the close neighbouring countries, such as Singapore, Thailand and China, where average Internet speed is much faster than 1.3 Mpbs in India. And to make the situation worse, India showed no improvement in the last 2 quarters, unlike China, Thailand and Malaysia.

 Facebook is shaping up well according to the demands of advertisers and fast-changing trends in the advertising industry. Facebook had initially faced many issues like – a large number of users shifting to the mobile platform, advertisers demanding more specific ad-campaigns, indigestible metrics for measuring ad success, lack of advertising initiatives for brands with niche audiences and a lot more.
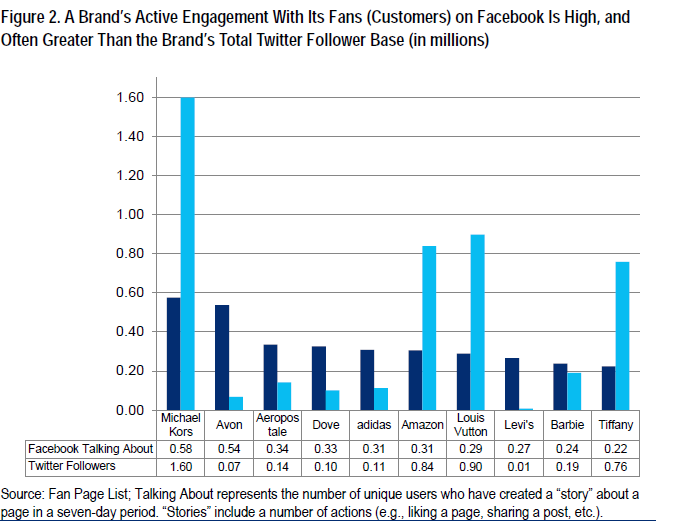


 Marketers looking to advertise their brands and attract new customers should focus on allocating a major share of advertising investment on social networks like Facebook Inc. (