A majority of upcoming brands across the globe invest heavily in advertisements, operations, marketing and other business segments expecting flourishing results on long-term basis. But, few countable ones spend time and money in analyzing or studying the consumer behavior, economic conditions, buying power or market potential of a particular demography. It is important for marketers or brand owners to conduct deep analysis or research before launching or expanding their business to a new demography.
The Nielsen Global Survey of Consumer Confidence and Spending Intentions, measures consumer confidence, major concerns and spending intentions among more than 30,000 respondents with Internet access in 60 countries. Consumer confidence levels above and below a baseline of 100, indicates degrees of optimism and pessimism. The Nielsen consumer confidence index measures perceptions of local job prospects, personal finances and immediate spending intentions.
The latest round of the survey conducted between August 14 and September 6, 2013, consumer confidence factor increased by nearly 57% of markets measured under the survey, compared to 45% in the previous quarter.
Global consumer confidence index (CCI) factor in the third quarter of 2013 rested at 94, without any significant change when compared to Q2 of 2013.
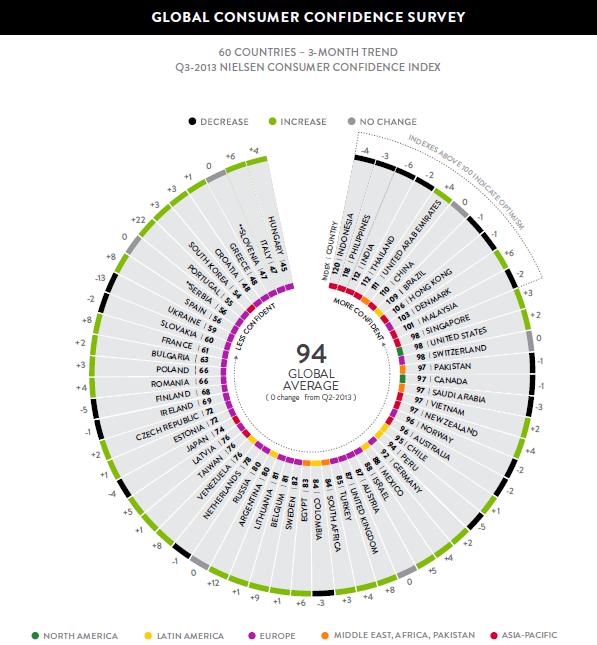
Indonesia emerged as the topmost country with highest consumer confidence index factor of 120, followed by Philippines (118) and India (112). Top five countries with highest consumer confidence index were from the Asia-Pacific. Hungary reported the lowest consumer confidence index (CCI) of 45, but posted a 4 point increase from Q2. Although a majority of Asia-Pacific nations were at the top of the CCI list, the observed growth rate was negative in most of the cases. Whereas the developed economies saw an enormous growth in CCI rates. Portugal reported the biggest Q-O-Q growth rate of 22 points and the overall score rested at 55.
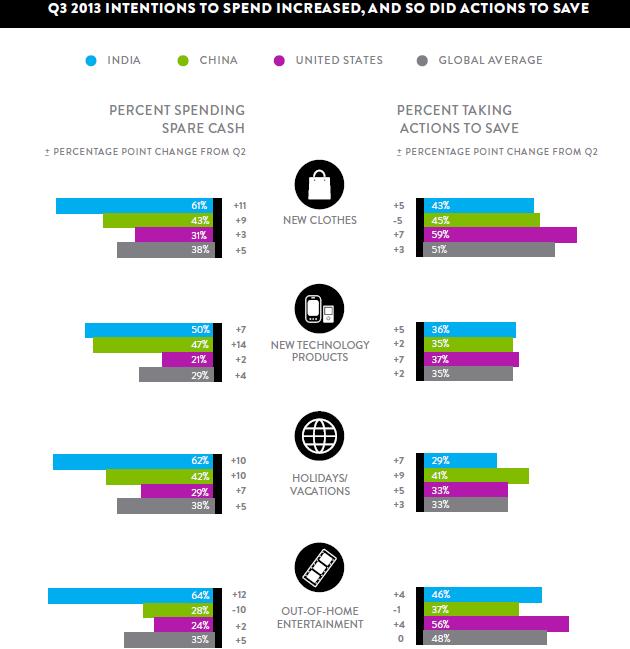
Although the CCI factors across various economies showed a diversified observation, discretionary spending intentions increased by an average of 5% across all categories measured in Q3 compared to Q2,2013. Nearly 38% of them upheld intentions to spend savings on buying new clothes(38%), spend on holidays/vacations was supported by 38% of respondents. About 35% preferred out-of-home entertainment and close to 25% of them decided to invest on home improvements. Intentions to buy new technology products (29%) increased 4 percentage points compared to Q2,2013.
Consumer Confidence In Asia-Pacific Declines, But Spending Intentions Increase!
Although the top few nations in CCI rating list belonged to the Asia-Pacific, confidence in these key developing economies continued to show a declining growth rate on Q-O-Q basis. Indonesia, in spite of being the topmost in rankings recorded a decrease by 4 index points, Philippines decreased by 3, India by 6 and Thailand by 2 points compared to the previous quarter. China and Russia both held steady from their Q2 2013 scores of 110 and 80, respectively. 8 of the 14 countries measured in the region posted a decreasing consumer confidence index rate.
An intention to spend was most evident in the Asia-Pacific and North America, where discretionary spending intentions increased across all categories. On an average a 7% increment compared to Q2,2013 was observed in investment on luxuries like new clothes, out-of-home entertainment and new technology products. If we analyse the graph below, nearly 61% (up by 11%) and 43% (up by 9%) of respondents from India and China respectively preferred spending spare cash on new clothes (both are well above par from the global average of 38%), whereas about 43% of Indians and 45% of Chinese folks were price sensitive when it came to buying of clothes. Shopping trends in other categories like investment in new technology products, holiday outings, out-of-home entertainment were somewhat similar.
Consumers from developing economies generally avoid switching brands and are more price sensitive. Nearly 92% of folks from emerging markets prefer retailers offering loyalty programs and extra incentives like free shipping, free products, discount offers. Retailers should design an optimum strategy to drive sales in developing markets of Asia-Pacific, extra incentives must be added to attract shoppers. Another important addition – availing a service guarantee for extended periods to attract money-minded customers who practice ‘showrooming’.
“The devaluation of the Indian rupee, the decreasing GDP, and negative news coverage on the economy has most probably contributed vastly to the low levels of confidence for consumers in India in the third quarter. However, consumers are still willing to spend more in the festival season. Festival time involves high consumption on travel, gifts, new clothes and entertaining. Although consumers are acutely aware of the economic pressures, manufacturers and retailers activate deals and discounts during this festive time period to give consumers more value for the money, which helps to ease their spending concerns,” said Piyush Mathur, president, Nielsen India.
Now, let us analyse the trend in the developed economies of North America. The CCI factor in the U.S recorded an increase of 2 points and rested at 98, an increase of 8 index points compared to its figure in the same quarter a year ago. Conversely, confidence factor in Canada reported a negative trend with 2 consecutive quarters of decline, from an index of 102 in Q1 to 98 in Q2 and then a further decline to 97 in Q3.
The growing positive consumer confidence sentiment in the Unites States was reflected in American’s increased spending intentions. Investment on home improvement projects increased to 24% (up by 8%), followed by holiday and vacations planning to 29% (up by 7%), purchase of clothes recorded a tally of 31% (up by 3%), out-of-home entertainment increased to 24% (up by 2%) and new technology products by 21% (up by 2%). A significant upsurge was observed in consumer groups who tend to save cash while purchasing products of the above mentioned categories. About 59% of folks (an increment of 7%) investing in new clothes preferred saving cash by opting for lower priced brands, nearly 37% (an increment of 7%) of new technology products users were price sensitive and 33% of travelers opted for low-cost tourist agencies.
It is important for brand retailers to provide exciting offers to consumers from the developed economies as more than 76% of them expect various incentives through exciting loyalty programs. Although a majority of customers in the region are economically strong, more than 61% of North Americans are price conscious. Cost of the products in these countries are much higher, it is important for retail brands to grab attention of customers by adding a few extra additives like free shipping or discounted prices.
“With U.S. inflation in check, confidence is now at the highest levels since 2007 giving consumers enough tailwinds to keep momentum moving forward, which may bode well for the upcoming holiday season. Fast-moving consumer goods dollar sales are up 2.1 percent year to date, and unit sales reversed a negative trend, now up 0.4 percent. However, residual effects from the government shutdown, debt ceiling, an uneven recovery, and the overall uncertainty that permeates the consumer mindset will likely curtail robust gains in sales.” said James Russo, senior vice president, Global Consumer Insights, Nielsen
Top brands looking to take their business to new heights should conduct a detailed analysis before venturing into that realm with any form of investment. Proper analysis of buying behavior, economic conditions and CCI factors must be conducted before forming any strategies about a product launch. Effective mobile strategy is required, as Smartphone penetration in the U.S and also in the rest of world is continuously on the rise. A Timely reply to queries and 24 hours of customer service must be the prime objective of every brand.