The global smartphone industry is still dealing with the lingering impacts of the COVID-19 pandemic and macroeconomic uncertainties in key markets. These factors have contributed to fluctuations in demand for smartphones across the world. The global smartphone shipments increased 7.8% YoY to 289.4 million units in Q1 2024, according to the International Data Corporation (IDC). The yearly growth, although in single digits, is appreciable given the previous trend of declining shipments observed over nine consecutive quarters until Q3 2023.
In terms of market performance, the competition between Apple and Samsung for market leadership remains intense.
Samsung reclaimed its top spot in the global smartphone market in Q1 2024, with a 20.8% share. Even though this market share figure is down from 22.5% in Q1 2023, it is a dramatic increase from the 16.3% share recorded in Q4 2023. Samsung shipped 60.1 million units of smartphones globally during the first quarter of 2024, with a 0.7% YoY decline.
On the other hand, Apple lost its top spot to Samsung in Q1 2024 due to stiff competition from Huawei in China and other Android OEMs. Apple shipped around 50.1 million units of iPhones in the first quarter of 2024, with a notable 9.6% YoY decline. As a result, Apple’s market share dropped from 20.7% to 17.3% within a year, falling from its peak of 24.7% in Q4 2023.
The standout success story of Q1 2024 in the global smartphone market comes from Xiaomi. The Chinese OEM has made a remarkable comeback from significant declines experienced over the past two years. Xiaomi recorded a strong 33.8% YoY growth in smartphone shipments in Q1 2024, totalling 40.8 million units worldwide. Additionally, Xiaomi’s market share rose from 11.4% in Q1 2023 to 14.1% in Q1 2024.
To reinvigorate demand for its smartphones in India, where it leads with an 18% market share, Xiaomi has shifted its focus towards bolstering sales through retail outlets in addition to its existing e-commerce strategy. This proactive approach aimed at diversifying sales channels has contributed to Xiaomi’s increased YoY growth in shipments and market share globally.
Transsion is one of the fastest-growing OEMs in the global smartphone market and is increasingly seen as a potential threat to Xiaomi. In Q1 2024, Transsion recorded a whopping 84.9% YoY growth in smartphone shipments globally, totalling 28.5 million units. In just one year, Transsion’s market share increased from just 5.7% to 9.9%, indicating strong demand for its devices and its growing presence in the market.
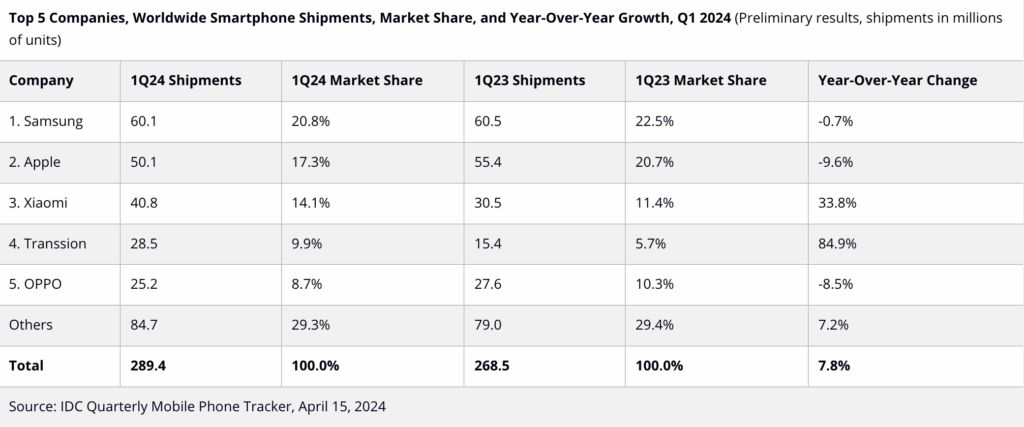
On the other hand, OPPO emerged as the fifth largest smartphone company in the world, securing an 8.7% market share in Q1 2024. The Chinese OEM is facing competition from its homegrown players like Transsion, Vivo, and Xiaomi. Oppo’s smartphone shipments declined 8.5% YoY during the first quarter of 2024, totalling 25.2 million units, worldwide.
Nabila Popal, a research director with IDC’s Worldwide Tracker team, has provided insightful commentary on key trends shaping the smartphone market. One notable trend highlighted by Popal is the rising value and average selling prices (ASPs) within the market. This trend is fueled by shifting consumer preferences towards higher-priced devices as they anticipate longer device retention periods.
In a Nutshell
The Global smartphone market is heating up with the competition, with the top 5 OEMs leaving no stone unturned to lure more customers. These companies have been introducing high-tech smartphones with 5G capabilities, flip and foldable designs, and other exciting features and specs.
The demand for premium smartphones has also surged over the years, particularly in India, driven by attractive discounts and offers from banks and e-commerce platforms. Amidst this dynamic landscape, Transsion’s rapid growth poses a challenge, making it interesting to see how Xiaomi will safeguard its third-place position in the worldwide smartphone market.
Which smartphone brand do you own, and What features or specifications do you value most? Let us know in the comment section below!