Home Blog Page 331

Apple Inc. (AAPL) To launch iPhone 6 On September 25: Drops iPhone 5 Trade-In Price !

0

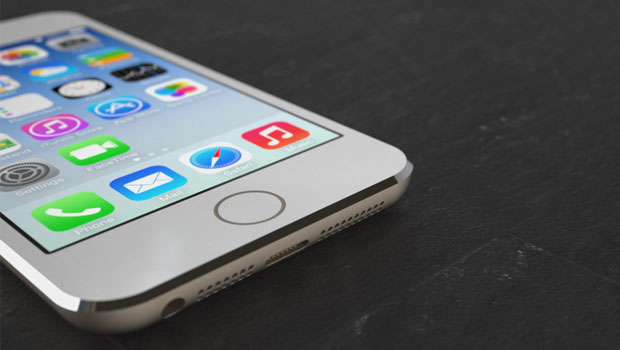
Apple Inc. (NASDAQ:AAPL) has apparently finalized the announcement and launch date of upcoming iPhone 6. The Cupertino based company will reportedly announce iPhone 6 on Monday, September 15, followed by the launch of iPhone 6 on Thursday, September 25. According to inside sources of few Chinese media, the price of iPhone 6 would be equal to the launch-price of iPhone 5S (Google Translate at GForGames). The reports have claimed that 5.5-inch screen iPhone 6 would be called the iPhone Air, price tagged with $965 for 16 GB variant in China. The 4.7-inch iPhone 6 may NOT be launched in 16 GB variant, while 32 GB iPhone 6 would be available for $850 in the country.

Apple iPhone 6 Air Image

These classified information, however, contrast the earlier report from Tencent that marks Friday, September 19 as the launch date of iPhone 6. Considering the past launch-history of iPhone, September 19 claims looks more authentic as Apple typically launches all new products on Friday. But, for a giant-size nexgen product development company the importance of day over strategy looks quite unlikely.

Yesterday, another report claimed that Apple is set to surprise people with iPhone 6 that may look completely different than the ones leaked in recent images, dummies and specifications. A curved-display could be the biggest surprise as Apple is likely to take a leap than other smartphone vendors by introducing latest innovation early.

Interestingly, if we go by the latest claim of iPhone Air, Apple doesn’t seem to have any plan to introduce 16 GB variant of iPhone 6. This could be another major strategic move by the company as in most of the emerging markets, including India and China 8 GB and 16 GB storage smartphone are scoring more sales figure than those of 32 Gb and higher storage variant.

However, it’s quite unlikely that Apple could launch both 4.7-inch iPhone 6 and 5.5-inch iPhone Air on the same day. The production delay due to battery performance and display technology of iPhone Air is reported as the main cause for this.

While rumors mills are making rounds on internet and it’s difficult to say which source does stand closer to the real iPhone specs, past merit of each source in leaking such information is the only way to find what Apple iPhone 6 would carry under the hood and how will it look like. Few days before we were introduced to new iPhone 6 images, purported as the most authentic and genuine images till date, and a video that claimed that iPhone 6 would carry new A8 processor and a 12 megapixel rear camera.

In another development, Apple has reduced the trade-in offer price of iPhone 5 ahead of iPhone 6 launch. Apple has cut the trade-in price offer from $270 to $225 now. However, these pieces are limited to Apple Store and users willing to upgrade their iPhone 5 to iPhone 5S or iPhone 5C could easily grab batter deal in open market. The move is also being considered as a pre-launch effect of the new trade-in program for iPhone 5S users, who would be willing to upgrade to iPhone 6.

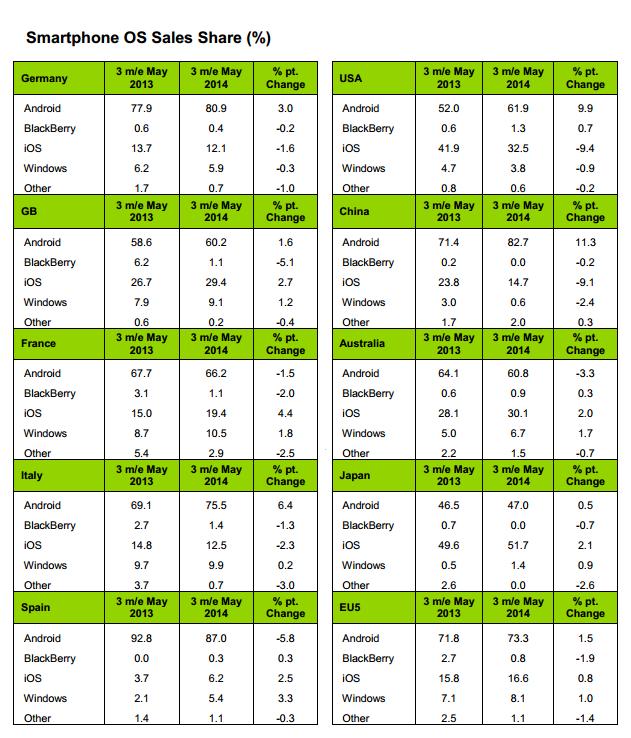
Apple is targeting to sell nearly 80 to 90 million iPhone 6 units in the first financial quarter. The giant 5,5-inch iPhone Phablet purported as iPhone Air, is expected to contribute at least 20% to this figure. Moreover, a new report that claimed that 35% of smartphone buyer are willing to ditch Android for iPhone 6 tuns the situation in the favour of iPhone.

Whatsoever, Apple can’t afford to make any delay further than September to introduce successor of iPhone 5S, and as the month if nearing, we are expecting to see some more new but legitimate leaked of iPhone 6 directly from Foxconn or some other vendors involved in iPhone 6 production.

Advertisement

Facebook Inc. (FB) Is The Most Important Platform For 54% Of Social Media Marketers In 2014

2

Almost all social media sites, including Facebook Inc. (NASDAQ:FB), Twitter Inc. (NYSE:TWTR), LinkedIn Corp. (NYSE:LNKD), have turned into a battle ground for brand marketers across the globe. Marketers are increasing their social media activities on various networking sites to generate leads and acquire customers. According to a ‘2014 Social media marketing industry report’ by Social media examiner, which surveyed over 2,800 marketers worldwide, nearly 92% of marketers considered social media as vital tool for their businesses, up from 86% in 2013. About 89% of marketers were keen to learn various social media tactics to achieve desirable results for their social media ad campaigns.

Facebook Was Up Voted As ‘Most Important Marketing Platform’ By 54% Of Marketers!

Nearly 54% of respondents up voted Facebook as most important marketing platform. LinkedIn was second most important platform for 17% of marketers and Twitter for 12%. In graph below we can see that Social media titan Facebook owns lion’s share of 54%, which is a significant improvement from 40% in 2013. LinkedIn, too, increased its share from 16% in 2013 to 17% this year. Interestingly, Blogging was in 4th place with only 8% of respondents voting it as important marketing platform.

important platform for marketsr May 2014

Although, analysts might have predicted doomsday for Facebook very soon, still its 10+ years of striving efforts has helped to maintain a niche for itself. The social media titan is on a dream run breaking all revenue records, mainly due to its advertising initiatives, like geo-targeting of ads, custom audience feature, ‘page reviews’ feature, mobile NewsFeed ads, ad targeting based on gender, age, browsing activity (cookies), dark posts and the news feed revamp. The social networking platform of over 1.28 billion users, accounting for 15.8% of overall time spent on internet, is bound to retain its top position for few more years.

LinkedIn, known as world’s largest professional networking site, gained second spot amongst marketers mainly due to its niche like-minded user base who network on platform mainly for business purposes. LinkedIn’s influencer’s group, channel content and LinkedIn Intro has helped marketers, especially the ones from B2B arena, to expand their businesses. Twitter is undoubtedly more viral and spreads news at wild-fire pace when compared to other networking sites but, its growing percentage of inactive registered users has caused greater concern amongst marketers.

Facebook: Favourite For 68% of B2C Marketers

If we breakdown the above analysis into marketers of B2C and B2B type, Facebook nearly outplayed all other networking sites with massive 68% of B2C marketers who are labelling it as their top choice for social marketing. Next in line was Twitter with 10%, followed by Blogging and LinkedIn with 6% share each.

best social media marketing network - B2C- may 2014

In B2B arena, LinkedIn proved to be dominant with 33% of marketers are favoring its usage over other networking platforms. Facebook, however, is not far behind with 31% of respondents prioritizing it as their first choice for marketing. Twitter is upheld by 16% and Blogging by 11% of respondents.

best social media marketing B2B

What Marketers Plan To Do In Future?

Social media marketing is fluctuating at lightning pace making it difficult for marketers to standardize any particular strategy to achieve desirable results. Most of the recently carried out social media marketing strategies are on trial and error basis. When respondents were asked “which online marketing strategy they would prioritize in future ?“, nearly 68% are in favor of blogging. About 67% are planning to increase their marketing activities on YouTube, 67% on Twitter, 64% on LinkedIn and 64% on Facebook.

Blogging, one of the most cost-effective and influential platform, is favored by 74% of B2B and 63% of B2C marketers. King of video content site YouTube is next in line with 67% respondents are planning to market their product through attractive video ads. Usage of Twitter increased from 64% in 2013 to 67% in 2014, attributing to the growing awareness of its  mass communication tool. Professional networking site LinkedIn too is in list of top priorities for about 64% of marketers. As expected, majority of them (in favor of LinkedIn) are from B2B segment (77%) compared to B2C (54%).

Top priorities of social media marketers 2014

Although, the social media giant Facebook was still considered vital by about 64% of marketers, its position moved down from second position in 2013 to fifth position in 2014. Search giant’s networking arm Google Plus was not far behind with 61% of respondents planning to increase their activity on the site. Google Plus hosts more than a billion registered users world-wide, its attractive GIF images has created significant buzz amongst marketers.

Pin board style photo sharing website, Pinterest (50%), photo sharing app Instagram (42%) and Vine (35%) are other networking sites where marketers have planned to increase their activity for rest of 2014. Marketers should plan their social media activities based on their product type and target audience. Presence and activity on various networking sites is required as trend keeps shifting from one social media platform to another.

Advertisement

Nokia Lumia 520 Remains The Most Favourite Windows Phone Despite New Entrants: Lumia 920 Leads In China

3

Windows 8 OS might have been unable to turn the desktop OS market in its favour but Windows Phone 8 is doing a great job in the Windows Phone mobile devices market. The combination of Lumia series and Windows Phone is definitely a good news for Microsoft Corporation (ADR) (NASDAQ:MSFT) and Nokia Corporation (ADR) (NYSE:NOK). Nokia Lumia 520 continues to capture the Windows Phone device market, while Windows Phone 8.1 improves its smartphone market share, up from 5.2% in May 2014 to 7.7% this month, according to the latest AdDuplex report. The report is based on data collected over the day of June 23rd, 2014 (UTC time) from 4,311 Windows Phone apps running AdDuplex SDK version 2.0. in 10 countries.

windows phone devices worldwide june

The adduplex June report is very similar to the report we addressed previous month with respect to Windows Phone devices. The entry-level and mid-range smartphones continue to be high in demand. Nokia Lumia 520, Lumia 625 and Lumia 920 continue with their top-3 positions respectively, though some swapping is clearly visible in the devices capturing the Windows Phone device market with low share. Even in the top-3 positions, a marginal change in the market share is visible. The Windows Phone device share of Lumia 520 went down from 33.7% in May, 2014 to 31.6% a month later. Lumia 625 and Lumia 920 witnessed a negligible increase of 0.6% and 0.7% in their market share respectively. However, the top-10 Windows Phone devices remain the same. The newly-launched device Nokia Lumia 630 is catching up fast since it jumped from 30th position last month to 20th spot this month.

Nokia Lumia 520 Gets New Kids on the Block

Last month there were only 4 major manufacturers dealing in Windows Phone devices but this month, we witnessed an influx of new OEMs though they failed to capture any market. Micromax, Panasonic and Prestigio launched their Windows Phone smartphones in this month. However, the failure to capture any market can not be seen as their loss. The increasing demand of budget smartphones is likely to fuel their sales in the coming months.

windows phone 8 manufacturers june

Nokia and Samsung Electronics Co., Ltd. (KRX:005930) managed to improve their market share in one month at the cost of HTC Corp. (TPE:2498). Windows 8.1, though in its infancy, is already attracting the customers. The notification bar and Cortana are some of the features that go a long way in making it user-friendly.

Nokia Lumia 52x Still Remains a Favourite Among Users

Out of the ten countries surveyed for the AdDuplex, it’s only the United States that was covered in May and June report both. The June report covered Windows Phone device market share in Australia, Chile, China, Mexico, Ireland, Germany, Italy, Netherlands United States and United Kingdom. Though the U.S. has been tracked for the past 2 months and Mexico has been covered after a span of 9 months, the Windows Phone device market remains almost unchanged. Nokia Lumia 520 and Lumia 521 continue to capture more than half the Windows Phone market in US, while in Mexico, Lumia 710 jumped from third position to second and Lumia 520 captured more than one-third of the market.

windows phone devices us

China is the only country where a device, other than Lumia 52x, is leading the Windows Phone device market. Nokia Lumia 920 captured almost one-fifth of the Windows Phone smartphone market in China. This is surprising since home-grown vendors are more famous in China and the country is largely known for supporting budget-smartphones, whereas Lumia 920 falls under the premium-price smartphone category. Infact, for the past four months, Lumia 920, Lumia 520 and Lumia 925 continue to hold the nearly 40% of China market in top-3 spots.

windows phone devices china

Nokia Lumia 92x and 62x Seize a Sizeable Market Share

In all the countries tracked by AdDuplex, Nokia Lumia 920, Lumia 925, Lumia 620 and Lumia 625 boasted of almost one-third market share combined. The 92x and 62x series captured 32.8% Windows Phone device share in Australia, 28.6% share in Ireland, 35.2% in Germany and 36.6% in Italy. All of these three Lumia devices fall under mid and high-range smartphones category and have a greater appeal in developed nations.

windows phone devices australia

The report covered Chile for the first time and, here too, Nokia Lumia 520 captured almost half of the Windows Phone devices market. Similar to Chile, Lumia 520 boasted of a market share of 46.4% in Ireland too. Lumia 520 has been hogging the market at first position since October in Ireland.

windows phone devices chile

Almost all the devices that feature in the Netherlands graph are new entrants but the market phenomenon is very much similar to other countries.  Nokia Lumia 925, Lumia 625, Lumia 1020 and Samsung ATIV S were recently added in the list while HTC 8S, Lumia 710, Lumia 900 and Huawei W1 failed to make their presence felt in the market and failed to feature in the top-10 list.

windows phone devices netherlands

Largely driven by Nokia, the Windows Phone devices hold a small share in the global market, but with the influx of smartphones at all price ranges and with the advent of new players this trend is likely to change. The global market share of Windows Phone smartphones is expected to almost double from 3.5% in 2014 to 6.4% in 2018. Inspite of being available in few devices and developers version, Windows 8.1 is doing a great job, the improved features are attracting customers. In addition to that, the budget phones have a higher appeal with the consumers but the mid-range and high-end Windows Phones are also appealing the users.

Advertisement

Make A Successful Referral Marketing Program That Brings Customers In !

1

Every person wants referral based work. Being a start-up guy myself, I know exactly why referral based business is good. It’s kind of traffic that comes only after hearing good stuff about you; It’s the kind of work that comes and stays. People who come to from referrals are more likely to trust you. Word of mouth advertising is what everyone craves for. Few years back, when I started my own website speed optimization service we had nothing to bank upon, search engine traffic was dead in the water. Social media traffic bought no work to us due to declining organic reach; because people came, they liked our stuff but never bought our packages. And those who actually made our business were friends of our existing customers, who were repeatedly being told how awesome were we and our services.

This led to the realization that a good referral marketing program is essential to any brand’s success. A good referral marketing program not only saves the time of the people involved but it also helps in building long lasting relationships and it seriously brings down the money involved in marketing and promotion.

The latest research report from Gigaom explains how ten different types of digital advertising are helping marketers to acquire new customers. retain current customers, boost the awareness and push them for conversation – without actually asking them directly to it. According to the report referral marketing bring customers in and email marketing keep them active & engaged. 31% of respondent claimed Acquisition and Conversion are the most effective referral marketing objectives.

Gigaom-referral

On the flip side, only 39% of people are using the referral program effective. Though 27% of this who were using referral marketing claimed 50% of their new customers bought in through it. The referral marketing tactics satisfies two objectives: acquiring new customers and rewarding the existing customer who referred them, this keeping the existing customers happy, claimed marketers who were surveyed.

Every company or brand working on building their customer base needs people. Now by the word people I don’t mean any Tom, Dick or Harry; It’s focused people who return from time to time and are the real sources of ROI for us. Some people from your referral sources might be the ones who are looking for reciprocal referrals from your side. Such people might even want you to refer them to everyone in order for the whole process to work out. If it fits your strategy then such mutually beneficial referral might also serve you good, but the end discretion in creating a successful referral marketing program is always yours.

Not every strategy that yielded results for other people will give you results. You might need to modify your existing action plans according to your business. Finding the right sources for referral is also a crucial component. The people who are coming to you need to be targeted audience. You won’t talk about your business and ideas with the friends of your brother or your mom’s peer group. What you need is people who already belong to that core industry, which you are a part of, and then you would  pitch your idea in front of them, which would lead to fulfilment of your referral strategy. So, to create a successful referral strategy what you need is to find the right people and promotion to the right people.

The five most important points to keep in mind while trying to build a long-term referral marketing program are:

1.) Find and classify good quality referral sources

2.) Take your own time to build relationships with people you work as it works the best for the long run

3.) Try and understand what people need and why they need it.

4.) From an industry based focus group which focuses on bridging the gap between consumer demand and the industry.

5.) Keep a track of all the referral sources.

After all you don’t want an adult site or a black hat forum to be the main source of all of your traffic.

Whatever your feedback, do submit your awesome response and take the discussion forward on Twitter by tweeting us back to @Dazeinfo  🙂
Keep coming for more such awesome posts!

Disclaimer: The original post was written by Aditya Nath Jha who actively contributes to Dazeinfo and MyRefers – a new peer to peer referral based job search platform. I have made few tweaks and added the survey findings section to make the thought more appealing and adaptable to readers. 

Advertisement

Apple Inc. (AAPL) iPhone Losing Users To Galaxy S5 In Europe, But Wins In Great Britain !

18

Across the five largest European markets 17% of smartphone buyers made the switch from Apple Inc. (NASDAQ:AAPL) iPhone to Galaxy S5. However, the marketing strategies of Samsung Electronics Co., Ltd. (KRX:005930) have somehow failed to make Galaxy S5 the largest selling smartphone in Britain. The device still lacks behind Apple iPhone 5S and iPhone 5C, claims Kantar Worldpanel Comtech in its latest Smartphone Sales Report Of 3 months, ended May 2014.

“The Samsung Galaxy S5 has had some success in attracting former iPhone owners across Europe.  In general, consumers buying the Galaxy S5 were primarily attracted by its large screen size. This is something Apple is likely to address with the rumoured larger screen iPhone 6 launch expected in late September,” said Dominic Sunnebo, strategic insight director at Kantar Worldpanel ComTech.

The sales of Android smartphones has again delighted Google Inc. (NASDAQ:GOOG) as Android share in the EU5 market went up from 71.8% in the three months, ended on May 2013, to 73.3% for the same period in 2014, recording a Y-o-Y growth of 1.5%. The EU5 countries include UK, Germany, France, Italy and Spain. Apart from Android, iOS and Windows Phone devices also witnessed a marginal increase.

Windows Phone maintains its Growth in Six Countries

Despite of having a low market share, Windows Phone OS has maintained a small but positive year-over-year growth in Great Britain, France, Australia, Italy, Japan and Spain. In Spain, the share of Windows Phone sales more than doubled from 2.1% in the quarter ended on May 2013 to 5.4% for the same period in 2014. Since the smartphone penetration is already high in these developing nations, urging the users to switch from their existing devices to Windows Phone is not a feasible move. In spite of all such factors, Windows Phone has managed an impressive show except in Germany, USA and China.

windows phone smartphone sales share May 2014

Chinese users largely lean towards low-priced Android smartphones from home-grown vendors, and very few OEMs are dealing in Windows Phone OS powered devices. However, Microsoft’s recent strategy to offer free Windows Phone OS to all smartphone and Phablet vendors could influence the presence of Windows Phone devices in positive way.

iOS Fails to Entice Consumers in Homeland

Call it lack of innovation, strategies or marketing gimmicks but Apple has failed to capture the market in a big way, although the fact that it is the only OEM dealing with its own operating system, iOS, and still having a sizeable market share is no less feat. iOS has registered gradual, but positive growth in Great Britain, France, Australia, Japan, Spain, EU5 in general. In Spain, it has almost doubled its market share to 6.2% in the quarter ended on May 2014 from 3.7% in three months ended May 2013. Spain and Australia are the only markets where all the operating systems, except Android, have registered a positive growth.

apple iphone sales share May 2014

The decline faced by Apple in the major markets, such as USA and China, can’t be ignored. Last year, for the same quarter ended on May 2013, China was one the biggest markets for the iPhone maker. But now, since the advent of local vendors that deal in low-priced Android smartphones, no other OS is able to make a mark in the country. As the smartphone shipments in 2014 is expected to reach 450 million in China, Apple needs to rework its strategy in the country if it wants to sustain in the rapidly changing market. A similar phenomenon was observed in USA where Android grew at the cost of iOS. In three months, ended in May, a year-over-year decline of almost 10% in both the countries is a cause of concern for Apple.

Android Continues to Lead the Pack

The sales of Android powered devices grew in all countries except France, Spain and Australia. However, the sales-share of Android smartphones is more than two-third in all these three countries, including 87% in Spain. In almost all the countries, barring Japan, the smartphone sales share of Android-powered devices hovers around 60% or more; in Japan, it has not even reached 50% while in China and USA, the growth of Android smartphones remains phenomenal at 11.3% and 9.9% respectively.

Android smartphone sales share May 2014

The fact that so many OEMs are venturing into the smartphone market with devices at all price ranges seems to accelerate the growth of Android powered smartphones. All these OEMs prefer Android as their first choice for operating system. Moreover, the cost of Android smartphones and availability of free apps in abundance on the Google Play Store is fuelling the desire to possess the smartphone. The new home-grown vendors are stretching out from their home-network and making their presence felt in the global smartphone market.

Blackberry Records Positive Growth in Three Countries

Considering the declining sales and market share, a positive growth in some major markets is definitely a boost up for Blackberry. Though marginal, Blackberry recorded a positive growth in USA, Australia and Spain. In USA, it doubled its smartphone sales share from 0.6% in the 13 weeks ended on May 2013 to 1.3% for the same period a year later. The share of blackberry smartphone sales in Spain went up from zero percent in 3 months ended May 2013 to 0.3% for 3 months ended in May 2014.

kantar may report smartphone os sales share

The three months ended May 2014 data shed some light on the scenarios in the major smartphone markets, though the trend hasn’t changed much since the three months ended April 2014 report. The advent of local vendors is fuelling the sales of low-range budget Android smartphones. Furthermore, the Windows Phone devices are also doing well and availability of Windows 8.1 in all devices is likely to fuel this growth. As far as iOS is concerned, the launch of large-screen iPhone 6 may turn the tables in favour of Apple as a majority of consumers are waiting for the device.

Advertisement

Apple Inc. (AAPL) May Surprise You With iPhone 6 Design, Specs And Price !

3

For last few months rumors mills have been busy in producing various leaks about Apple Inc. (NASDAQ:AAPL) iPhone 6. Few claimed to have legitimate images of iPhone 6 design, while few others about specification. Price of iPhone 6 remained the only factor that made round of rumors and have kept everyone keep guessing. But, the new report from Japanese website claims that Apple may surprise everyone with final model of iPhone 6, significantly different from dummy models in designs and specification rumors making the round on internet.

Apple iPhone-6-image-leak

Apple iPhone 6 will not look exactly the same as claimed in various leaked. While the production is yet to kick-off, there are few changes in design that the company will bring for final production. It’s important to note that none of the leaks, till date, were originated from Foxconn – the main production factory of iPhone. Though, there would be few similarities but there are areas Apple is considering to improve.

Most of the leaks were based upon dummy models that were produced with low-quality material to keep the cost low during the early stage. As Foxconn and other major iPhone factories are gearing up to production, Apple has approved few changes to keep iPhone 6 admirable.

Among all the new changes, Curved-display is the major highlight. With iPhone 5S, Apple introduced finger-print scanner as the main upgrade, this time company would introduce large curved-display iPhone 6 to take the distinctive lead than archrival Samsung. Last year, in October, Korean electronic giant introduced the first curved-display smartphone, Galaxy Round. Unfortunately, the smartphone didn’t get the expected response from the market due to heavy price tag of $849.

Another major change, from design prospective, would be the placement of Apple logo on iPhone 6. The logo will eventually be changed to match the one currently found on Macs. This will bring a glow to logo, exactly in the way it happened with logo on Macs.

If Apple brings these changes to iPhone 6, chances are high that it may attract few changes in specifications too. However, it’s yet not clear whether these changes will be limited to giant iPhone 6 Phablet device with 5.5-inch display or will also be included in 4.7-inch iPhone 6.

Latest rumors are marking September 19 as the launch date of Apple iPhone 6, with 32 GB and 64 GB variant.

Despite of slowdown in iPhone sales during second and third quarter of the year, Apple will apparently close the financial year, ending on September 30, with record iPhone sales.  With estimated record sales of iPhone 6, Apple would start the fiscal 2015 in a style.

Advertisement

Mobile Music Touch Gloves: Wear And Play Like Beethoven !

0

This reminds me a popular Hollywood movie “The Tuxedo”, featuring Jackie Chan. In the movie Jackie wears the tuxedo, along with the watch, and select the desired characteristic to get equipped with; be it a fighter, dancer, musician or singer. Not all of that, but these gloves does exactly the same thing when it comes to playing piano.

These could easily be mistaken for a pair of gloves worn by weight lifters at the gym, but they are not. Furthermore, if you’re not keen enough, you may think they are just simple black gloves worn for fun. But instead, these are special multifunction gloves that you wear and play music like the legendary composer and pianist Beethoven. At the same time, you could wear them in the event that you injured your spinal cord and you’re not able to correctly move your fingers or even sense a thing.

Wearable music touch gloves
Created by researchers at Georgia Tech, the MMT or Mobile Music Touch Gloves can do wonders as far as moving fingers is concerned. They were created specifically to improve sensation as well as movement of hands. In case you got a spinal injury such that you’re not able to move your fingers well, these special pair of gloves will help you learn how to move those fingers in a fast and efficient manner. You can then play the piano.

Where it all begun?

It sounds like a very complex technology to master, yet it’s not. When research was being carried out on the gloves, they only sampled patients who had suffered spine injury more than a year ago. Those who had sustained injuries less than a year ago could not show results.

All in all, the participants wore them in their hands, just the same way you’d wear a pair of gloves when you want to play a piano. The Mobile Music Touch was so accurate that it could vibrate in every finger to let them know which piano keys to press. They improved sensation and motoring skills in individuals.

Mobile Music Touch Gloves: Wear and Feel like Beethoven

They doubled up as a medical equipment coincidentally because of the fact that they offered a solution to piano lovers who could not play music due to injury on their spine.

Today, the MMT system is very basic as it consists of a device attached to the back of the gloves, then connected through a wireless network to the computer, smartphone or MP3 player. The whole arrangement feels quite uncomfortable on hand but considering the technology is at it very nascent stage, the future looks promising, especially when small chips are ready to replace bulky components.

How they work?

For them to work a song must be programmed into the wireless device and the correct key illuminated on the keyboard. The gloves will vibrate to signal which keys to hit. Because of this, the wearer can play along with the song, eventually mastering where the respective keys are positioned on the keyboard.

Their effectiveness

It’s remarkable how some people have reported to immediately feel the hotness of a cup of coffee the instant they touch it. This could also hint that they may be more efficient that our very natural sense of touch or temperature.

Sharpening your ”Beethoven” abilities were just a secondary focus of the study

Apparently, these gloves weren’t created specifically for playing piano. Instead, the study put more emphasis on how well patients could sense vibration as they went about their own duties. Consequently, they were required to wear them for 2 hours every 5 days. But it also turned out that participants could play songs faster and retain them better, so the researchers hoped that they could double up as excellent music tools. This a year old video showcases how MMT used to work earlier and in last one year the technology has improved multi-fold and there are many new enhancements that are made to to MMT.

It’s true that they’ll make you feel like Beethoven when you hit the piano keys. They are so accurate and magical that you won’t believe it. The MMT system is also believed to activate dormant parts of the brain by triggering the sensory cortex on your fingers, which in turn fires charge into the brain. It’s definitely worth your money if you know you can’t play music like the legendary Beethoven.

Wearable Gadgets Hold Unlimited Potential

2014 is apparently going to be the year of wearable gadgets. Almost every tech giant is working on one or another wearable technology/gadget. Smart Glasses, Smart Clothing, Gesture recognition are few of the major wearable technologies ready to revolutionaries the industry. Samsung Electronics Co. Ltd. (KRX:005930) has taken a lead position by introducing Smartwatches and Health & Fitness bands early in the market. Sensing the huge potential, Google Inc. (NASDAQ:GOOG), Apple Inc. (NASDAQ:AAPL) and Microsoft Corporation (NASDAQ:MSFT) have also joined the race with their wearable technology or gadgets, reportedly scheduled for launch late this year. Other electronics giants LG, Sony, Nike are not much behind; LG G Watch and Sony Smartwatch are also making the round of rumours for some time now. Wearable electronic market, alone, is estimated worth $8.36 billion by 2018 and considering new innovations in wearable space, the overall wearable industry could easily cross the $20 billion mark by 2020.

Disclaimer: This article was originally written by Tom Tyrrell for Dazeinfo. He is one of the two brothers behind the amazing nfc information ground. They began researching the potential of NFC in 2008, eventually founding NFC Direct in 2012. They now offer customers the complete NFC solution. To make it more valuable for readers, I have made few tweaks and added the growing scenario of wearable industry.

Advertisement

The Coming-of Age Of Social Media In Middle East: 191% Growth In Six Years !

0

Out of the 7.1 billion people in this world, an impressive 85% have access to internet. 25% of the world’s population is using social media in some form or the other, while 73% of the online population uses social networking site of some kind. Evidently, Social networking is undoubtedly the most performed online activity.

Social media transcends geography, and the sheer scale and diversity of audiences puts their importance on the highest pedestal. A growth chart of social media usage is given below, and it shows how different regions will respond to social media revolution.

It wouldn’t take a genius to discover that social media in Middle East, the region mostly known for its regressive government policies and shady human rights practices, is actually gaining huge grounds. This graph depicts a 191% growth in the Middle East & Africa region, even higher than the rapidly growing Asian economies such as India and China.

Social Media Growth 2011 - 2017

While social media is mainly about the general population, a reflection of the public mood and trends, it is also heartening to notice that many governments in the Middle East are opening up to implementation of Web 2.0 tools and capabilities in their national agendas. A collective theme in Bahrain Vision 2030, Saudi Arabia 2020, Dubai Strategy 2015 and Qatar Strategy 2030, the respective national agendas of their countries, was inclination towards inclusion of Web 2.0 attributes such as collaboration, transparency, communication and empowerment.

How it all started?

It was the spring of 2011, when world witnessed the revolutionary wave sweeping across the whole Middle East, right from Egypt to Tunisia and beyond. This was the period when social media acquired a new meaning in this region, from that of vigilante to a news source, to a distribution channel effective like no other to online activist entity of its own.  Facebook became a major catalyst in this civil unrest, as did Youtube.

Following the death of an Egyptian businessman Khaled Saed on the hands of some unruly police personnel, a Facebook page was created, named “We are all Khaled Said”, that attracted more than 500,000 members.   What followed was unprecedented and led to the ouster of the then Prime Minister of Egypt. These upheavals in the Middle East have thrown a positive light on the social media to effect change, and have had a liberating effect on the population, motivating them for better and more utilization of the internet.

How social media is used in the Middle East?

When not affecting a regime change, social media finds itself being used in more humanly fashion in this region. According to the data provided by 5th  annual Arab Social Media report, Facebook has registered over 55 million Arabs while Twitter reached 3.7 million users. UAE is the country with maximum Facebook penetration at 41% while Saudi Arabia has more than half the Arab active Twitter users.

The findings of the survey show that social media’s growth provides a boost to innovation and impacts education in a positive manner in the Arab World. The Governance and Innovation Program at DSG conducted the survey with a sample set of 4000 participants. 55% of respondent teachers said that they were using social media as a classroom resource.  Besides, around 68% of respondent parents said that online resources helped their children in catching up with lost time owing to political interruptions in regular schooling. Rise of social media has given birth to terms like ‘social learning’.

Another survey conducted by the Northwestern University, Qatar, Doha provided more detailed insight into social media usage patterns of Middle Eastern. The results revealed that citizens of Arab world spend an average of 3.2 hours a day on at least one or a combination of different social networks. All countries, except Qatar and Egypt, had more than 90 % of their population using social networking sites. As expected, Facebook is the mother of all social networks, with a whopping 94% of the surveyed people responding positively to having a presence on it. Twitter was distant second with 52% user and Google+ achieved third position with 46% of respondents having its presence on it. However, a lot of social media worth of this region still lays untapped as seen here. As per this infographic, the Middle East alone has a potential of 209 million new users who could be possibly using one of the social media platforms for different purposes.

Social Networking users in 2013

An impending digital revolution in Middle East

As per data provided by Google, Saudi Arabia is globally number one in per capital YouTube views. The Middle East ranks second, behind only the United States.  This stat becomes all the more impressive when we factor that the region has only 90 million active internet users. On the other hand, the region is currently experiencing a youth bulge. It has over 30 percent of its population between the ages of 15 and 29. This segment of population represents a huge market in digital space.

While social media is the biggest part of this space, other activities like online learning, online recruitment and e-commerce are also gaining traction. A recent development saw Souq.com, the region’s first e-commerce and online shopping portal raising a financial backing of US$150 million. This magnitude of financial backing can be rightly assumed as a sign of a fast-growing e-commerce sector. United Arab Emirates leads the pack here, with approximately five in ten people trusting internet for shopping of goods and services according to The Online Shopping Behavior 2013 study. The exponential growth of online shopping in Middle East is a symbol of more technology-savvy and digitally aware customer.

Online recruitment is another positive development in digital space of Middle East. The major players in this arena, such as Naukrigulf, Bayt and Gulftalent and few others, are making a strong foray into online and mobile recruitment process. When Naukrigulf.com launched its iOS app last year, it quickly climbed the chart to become the most downloaded business app in the App store in Middle East, verified by independent app analytics platforms like Distimo.com and Appannie.com. This is a clear indicator of the fact that the Middle East is in actually in the ‘middle’ of a transforming experience, leveraging different digital tools, & social media is the most important of them.

Saurabh Tyagi is an expert author, with an experience of over 4 years in writing content for articles and blogs. He loves to write on topics related to career, education, technology, working in the middle-east, what is trending in the job market of Dubai and other Gulf countries. A gadget freak and social media enthusiast, he also keenly follows the latest trends in digital marketing.

Advertisement

Apple Inc. (AAPL) iPhone Users More Health Fanatics: Canadians Most Health and Fitness Conscious !

0

Move over wearable gadgets; health and fitness apps are more accessible on smartphones. The desire to stay connected and healthy is growing exponentially globally. In recent Opera Media Works insight, Canadians were found to be most engaged with health and fitness sites and apps while Russians were least interested. Apple Inc. (NASDAQ:AAPL) iOS users are more in-sync with the health and fitness apps than users on any other platforms. The study, done before world’s biggest advertising award show Cannes Lions, focuses on mobile advertising and use of health and fitness applications and sites. It is based upon 500 million monthly impressions on 400+ sites and apps focused on health and fitness industry, and a survey, which was completed in May, 2014.

225% More Health and Fitness Traffic In Canada

Mobile and internet users in Canada and Australia seems more engaged and conscious towards their health. Both the countries generated more engagement towards health and fitness compared to other countries. To understand this engagement the study compared the ratio of traffic, coming from health & fitness sites and apps, with impression ratio from each country; less traffic but more impressions. Canada topped the list of highly engaged health & fitness countries with 225% ratio difference between traffic and impression. United States, though, generated the maximum ad impression but whence compared to traffic it fall behind Australia and United Kingdom. The developing nations, like Brazil, India and Indonesia, didn’t show well with health & fitness engagement. Russia emerged as the worst country where mobile and internet users are apparently least bother about health and fitness. Considering the smartphone penetration and 3G and 4G technologies in the developed countries, this is not surprising at all. Besides, people in developing and poor nations are least likely to seek medical help online.

health and fitness traffic related to total impresseions

Opera Media Works went on to define the terms Health and Fitness. Health sites and applications are the sub-categories focusing on medical and healthy lifestyle whereas fitness sites and apps cater to issues such as exercise interests or weight control. Compared to the most countries where health and fitness go hand-in-hand, a diverging relation was found in some countries. Based on the medical facilities offered in a country, few cases were designed where health and fitness app quota is less than the total impression. These countries are segmented on the basis of number of doctors for every 1000 persons.

app usage segmented to doctors per capita

The countries where doctor per capita is more, users were more aware and indulged in more health and fitness apps, accounting for 67% health and fitness impression. But nations with lowest number of doctors, users consumed less than 1% of the health and fitness apps. Taking into account the low smartphone penetration, lack of medical facilities and awareness about the health issues, this data is unsurprising, but troubling. However, for the app developers, this reveals a huge opportunity window of untapped users.

Apple iOS Users Are More Health Fanatics

Against the total impressions from all sites and apps on iPhone, health apps and sites are browsed more than double the total usage of all other categories. In another report, the health and fitness app usage on iOS grew by 62% compared to the total app usage growth in 1H 2014. Retention rate and app usage of iOS users is significantly higher than Android users. But the health and fitness app users prefer using these more on iPhones than the iPads. Considering that 4-inch iPhones are handier than iPads and nature of apps, it’s a justified move.

app usage on platforms

However, a disturbing phenomenon was observed with the Android users. Though the global market share of Android is significantly higher than iOS, the health & fitness apps and site impressions on Android is low. The penetration and usage, both, of iPhones and iPads is high in the developed nations, which also recorded higher health and fitness app and site impressions. Usage of Android-powered devices is more in the developing nations where the health and fitness app impression is low. The impression of usage across both the platforms is significantly low on tablet devices. This can be partially attributed to the declining growth of tablets in Q1 2014.

Pharmaceutical Ads Generate the Maximum Revenue

The lofty impressions recorded in some countries are a way for developers to monetize from ads. Food & Drink ads vertical caters to both health and fitness industry and generates 0.61% and 63.2% ad revenue for the industries, respectively. In the fitness segment, apparel ads also attract the users, while in the health segment pharmaceuticals generate maximum revenue of 88.3%. The other parameters are significantly lower in the health section.

revenue generated by app

The usage pattern of both the health and fitness industry is contrasting. While the usage of fitness apps and sites was recorded more in post afternoon session – from 3 pm to 10 pm – the health apps and sites were used more in the morning session – from 9 am to 3 pm. The peak hours for health apps also vary; 12 pm to 1 pm for health apps and 9 pm to 10 pm for fitness. The usage of health related sites is more during day while that of fitness is during evenings and night. However, the usage of both the industry was found to be maximum in mid week like Tuesday and Wednesday, while least in the weekends.

time and day usage patterns

Interestingly, the app usage is maximum during the lunch and dinner hours on weekdays. Moreover, health and drink ads attract both the health and fitness usage. It’s a good opportunity for ad developers to monetize this and throw more related ads to the audience. The distinctive growth of health and fitness app industry offers lucrative benefits for the ad developers and publishers. But the publishers need to focus more on Android devices and cater the audience in the developing countries as well.

Take Aways:

  • Canada and Australia must be the prime focused market for health & fitness focused sites and app developers.
  • Health & Fitness product companies must spend more marketing dollars on Canada, Australia, UK and US.
  • Health & Fitness content publishers strategies their marketing efforts more on iPhone and iPad to reach more consumer as compared to Android.
  • Apps and sites focused on fitness activities must kickoff their marketing quite early in hours on weekdays. However, Health information is more like knowledge, which people like to consume in during the off hours of the day.
Advertisement

Mobile Malwares Grew By 167% In 2013: Total Malwares Cross the 200 Million Mark !

0

The increasing infiltration of smartphones in our lives spells good news for cyber criminals. Just a few days back, we talked about the Trojan, Android.Trojan.Uupay.D, which runs in the background and sends sensitive information to an untraceable, anonymous server in China. But the sad part is, this is not the only malware infecting smartphones. According to McAfee Labs Threat Report, for the first quarter of 2014, the total number of mobile malwares has grown by 167% in last one year. The malicious apps are mostly in form of clones of some famous mobile apps and exploit vulnerabilities of legitimate apps and platforms.

malicious WhatsApp

More Than 750,000 New Mobile Malwares in Q1, 2014

In the first quarter of 2014, more than 750,000 new mobile malwares were discovered, making the cumulative figure of total malwares to reach around 3.8 million. The figures are not surprising at all as the total number of malicious apps on Android reached 2 million in Q1 2014. The majority of apps are disguised as a legitimate app or its update. The malware additions this quarter are the second highest in last two years, after more than 810,000 mobile malwares detected in Q4 2012.

total mobile malware

As per the graph, the total mobile malware grew from 3.15 million in Q4 2013 to 3.8 million in Q1 2014, recording a 22.2% quarter over quarter growth. The yearly growth in number of mobile malwares stood at 167%, up from 1.45 million mobile malwares in Q1 2013 to 3.8 million in Q1 2014. These numbers represent the unique samples of malwares instead of the malware families.

McAfee labs counted more than 200 million total malware samples – includes desktop and mobile both – in Q1 2014. The mobile malwares represented 1.9% of these total malwares, which shows the growing influence of malware on mobile users.

Malware Launches Other Malicious Apps

Traditionally, the malwares exploited the platform they were launched on, but now they also abuse the services and features to install other apps illegitimately without users’ permission. Manual download and installation of an app from Google Inc. (NASDAQ:AAPL) Play Store requires authorization from user but a Japanese-language malware, Android/BadInst.A, automatically retrievers a user’s Google account and requests for the permission to access various Google services.

japanese malwareThe whole reverse-engineered protocol involves a standard framework API, AccountManager with approved permissions. The granting of permission plays a critical role in launch of other apps, but since this app has the required valuations; it automatically downloads, installs and launches other apps without the user intervention. The authorization tokens can also be used on third-party app stores.

Malware Poses Threat to Digital Wallet and WhatsApp

The growing adopting of mobile app has provided new avneues to malware app developers. A disguised game app, BaloonPop, steals the WhatsApp messages and pictures to send to a remote server for decryption. The Trojan, Android/Balloonpopper.A, exploited the encryption weakness of the popular messaging app and the data was decrypted and launched on the website of Attacker. This poses a greater threat to users’ image, shared through the most popular mobile app. The violated security on WhatsApp through these malware apps exposes pictures to unwanted users.

malicious WhatsApp2

Another Trojan, Android/Waller.A, get installed as a licit utility app or an update of Adobe Flash Player, but hidden from home-screen. The app makes use of the money-transfer protocol of Visa QIWI Wallet to check the account balance and transfers the money to the attacker’s server by intercepting the confirmation response.

malicious adobe flash player app

The Clone Of Flappy Bird Attacks!

Since the pullout of popular game, Flappy Bird, hundreds of impersonators of the game emerged out. Out of the 300 samples taken by McAfee labs, 238 samples were malicious versions of the game. The clones are taking advantage of the reach that the game had; it was downloaded 50 million times. These malwares are notoriously famous for making calls, sending messages, reading IMEI number, MAC address and installing applications without the users’ permission. These clones also extract the GPS location and send user activity data to third-party sites.

flappy bird clone

Q1 2014 has been a risky quarter in terms of malwares, malicious apps and messaging threats. The spam mails were three times the legitimate e-mails. Moreover, the number of spam mails were the second largest in this quarter after the Q3 2013.

The growing demand of smartphones is alerting the cyber criminals too. Though iOS is touted to be more secure, it also suffering from malicious apps. With more than 500 apps being added on Windows Store every day, Windows Phone OS also poses great opportunity for attackers. They see this as an opportunity to use and abuse the features and vulnerabilities of the apps for their advantage.

The malwares attacking the messaging apps pose a privacy threat to the content shared by users. The digital wallet apps have the vital information shared by the device user which can potentially harm the user if leaked. Although steps are being taken to safeguard the user, there is no foolproof method. A little restrain from the third-party app stores and granting of unnecessary information to the apps can make the devices safer and more secure. The app developers should also install every possible method to protect their apps from such malwares.

Advertisement

10 Statistics About India That Will Leave You Stunned: Hair Import, Alcohol Consumption, Road Network, Richest Men And More !

0

Some of you – avid followers of Dazeinfo – may find this article a little off-the-track, but eventually it’s all about statistics and data-points that help companies to accelerate their growth by multi-fold. Even the Tech professionals, like you, need to empower themselves with fact-based intelligence related to surrounded ecosystems – beyond technology industry.  These ten-point surprising statistics about India expose how world’s second largest country, by population, is heading towards achieving few commendable milestones regardless of sub-standards infrastructure and few humiliating facts as compared to many other developed nations.

india ten statistics

These statistics consist projection on industry growth, GDP, india’s wealth and living scenarios.

  • Most of us know that global demand of Indian hairs is growing exponentially. This has made India as the largest exporter of hairs. Even, world’s largest ecommerce stores couldn’t refrain themselves by encashing the opportunity; Alibaba.com has identified this sector as one of the fastest growing businesses in Western countries. Every year, India exports over $415 million worth of hairs, the largest chunk of this going to south pilgrims, especially those who pay a visit to Tirupati. Nearly 40,000 pilgrims are believed to donate their hairs every day. By 2020, the industry is estimated worth $750 million, creating a huge opportunity for businessmen.
  • In last one decade almost every developed economy worldwide suffered from recession. India, however, remained few of those blessed countries that either didn’t suffer from the global melt-down or were affected the least. The strengthened economy of India has attracted many overseas brands to venture into the market, giving Indian consumers a fleet of shopping options. According to Boston Consulting Group research, indian consumer had spend $991 billion in 2010 and this figure is expected to surge up by nearly four folds to $3.6 trillion in 2020.
  • Dairy products from Switzerland are known as best products worldwide though, Indian has world’s largest dairy cow population.Disclaimer: There is no scam/controversy from Bihar is involved and Lalu Prasad could be the driving force behind increasing number of cow population. 🙂According to data published by DairyCo in January 2014, Indian recorded the fastest growth in cow population, up from 41.4 million in 2011 to 44.9 million in 2013. Nearly 18% of total cow numbers worldwide are in India.
  • Work hard, party harder! Probably, this mantra is seeded in Indians till core. Most of Indian professionals are service men but the consumption of alcohol is even more popular among people. Per capita whisky consumption in India is lower than many other countries though; about half of the world’s whisky consumption in 2012 happened in India. Indians consumed about 1.2 million liters of whiskey in 2012.
  • For developed countries, the biggest concern is growing population of old-age people. In contrast, the young-age population in India, 15-34 age group, is expected to rise from 430 million to 464 million in 2021. This will make India the youngest country by 2020.
  • The combined net-worth of 25 people in India is almost equal to Ukraine’s GDP. India’s top 25 richest people have  a combined net worth of $174.8 billion. The richest man in India, Mukesh Ambani, alone contributes $24.2 billion to this.

But, on the flip side, there are surprising facts enough to humiliate countrymen.

  • How should countrymen feel when they learn country’s capital is awarded with the world’s most polluted city tag? The World Health Organization found that India’s capital, New Delhi, is  posing a serious health-risk for people. The city is awarded as the most polluted city in the world. The pollution level in New Delhi has reached to 350 micrograms per cubic meter of air, which is seriously dangerous for human lungs.
Advertisement

Amazon Fire Phone: Firefly, M-Commerce, Forked Android – Make Or Break Scenarios ?

0

Launching a $649 smartphone in an already saturated market may seem a naïve move to many but not to Amazon.com, Inc. (NASDAQ:AMZN). The debates and speculations are still high whether the Fire Phone will be successful or will it back-fire? But ComScore looks at Amazon’s move as a pretty smart one considering the growth of m-commerce industry. The online retail giant is optimistic on leveraging on its wide reach to increase its retail business through the smartphone.

The smartphone industry is booming though, shopping on mobile devices is yet to gain much traction. Amazon, with its pre-installed apps, plans to challenge that. The retail benefits offered to Fire Phone users are endless including the Amazon’s Shop app, Kindle Books, Amazon Music, Audiobooks and Amazon app store. In addition to the pre-installed apps that facilitate shopping on mobile devices, Amazon also offers free-12 month Amazon Prime services to Fire Phone users. Amazon Prime is the free shipping of all goods and access to music and videos in exchange of yearly membership of $99. These offers are enough to entice the customers to think of the deal as the win-win, but this may help Amazon to acquire few heavy-duty shoppers in long run.

M-Commerce Industry In U.S. Accounts for Less Than 12% of E-Commerce Industry!

The m-commerce sales in 2018 is expected to reach $626 billion – equaling the e-commerce sales in 2013. However, the m-commerce sales currently hover around 10% of total online spending. But the global market scenario will have least impact on Amazon Fire Phone sales as US being the prime focused market for Amazon – at least for next few quarters – where the company enjoys the strong leadership position. Mobile commerce market in the US hit $25 billion in 2013 and majority of Fire Phone sales will come from the same market this year. Mobile users spend 52% of their mobile time on exploring retail category during Q1 2014, in contrast, the dollars spent on buying from mobile is quite less. In the online shopping era, Amazon and eBay Inc. (NASDAQ:EBAY) are the clear market hoggers in the US. Amazon reaches out to 250 million users worldwide with majority of mobile shoppers. These  figures clearly present a scenario where Amazon would be benefited from acceleration of m-commerce.

Time and Money spent in retail section

Firefly and Forked Android: Make or Break Scenarios?

Amazon Fire Phone comes packed with a feature designed to take on the real showrooms. The important interesting feature, Firefly, has the ability to scan items in the real world and direct the user to those items in the Amazon Store. Combined with the yearlong free services of Amazon Prime, this might be a devastating scenario for the real outlets.

Based on the forked Android, Fire OS 3.5, has very few apps in its kitty. Lack of apps in a smartphone or the app store does not seem a doable option for the consumers who consider their mobile phones as one-stop-solution for all things. Furthermore, compelling the users to switch from an existing smartphone to a complete new brand is a tedious process, specially when the smartphone boats a complete UI. Moreover, switching between phones and discarding all the paid apps seems a far-fetched move.

Although the mobile shopping is touted to become a big industry, the market share tells a different story. Apparently, launching a Fire Phone with a high-price tag for the retail purpose may be an unwise move. With the declining average selling price of mobile devices, users are making an informed choice about putting their money. The availability of price-compare apps puts the consumer at an added advantage as they can judge against the prices offered at all websites and take the best deal. Moreover, with the free shipping option available on major online retail stores, the 12-month free Amazon Prime services may not lure the customers. In spite of all the guesswork going on in the tech industry, the fact remains that Amazon’s strategies have always worked out in its favour, be it retail marketing, e-books, instant streaming, pay services etc. If the features and cost click with the consumers, we might see another OEM vying for consumer’s attention and smartphone market share.

Advertisement

41% Buyers More Interested In Apple Inc. (AAPL) iWatch Below $200 !

1

The rumors and speculations prior to an Apple Inc. (NASDAQ:AAPL) product never cease. The upcoming iPhone 6, launch dates of iWatch and the screen-size of iPhone 6 Phablet device are all a hot topic in the tech industry. While the launch dates and specifications of iWatch are still are the rumour stage, Piper Jaffray, an investment firm, did another survey on the likeliness of buying an iWatch. According to the findings of the survey only 14% respondents were interested in buying an iWatch priced in a range of $300-$350. The Piper Jaffray Watch & Wearables survey was conducted on 100 North Americans, average aged 32 years with a household income of $130,000. Surprisingly, nearly 61% of the respondents were female, who seems to be more interested in smartwatch due to health and fitness consciousness.

Highlights of the Survey

  • 35.26% individuals are not likely to buy iWatch irrespective of the price.
  • 14% adults were interested in buying a $350 iWatch, a 2% point increment from the October 2013 survey.
  • Almost one-fifth of the respondents already owned a fitness band.
  • 32% of respondents are likely to wear both a fitness band and an iWatch.

iwatch for $350

Users More Interested in iWatch below $200

86% of respondents are uninterested in buying a $350 iWatch. However, on further prodding, almost half of them could be coaxed into buying if the price was lowered. 48% of uninterested buyers or 41% of all respondents are likely to buy the iWatch if priced less than $200. It’s worth noting here that all the pricing is speculation based; the official price from the Cupertino-company is still undecided.

Apple iWatch price sales 2014

In its earlier survey, done by Piper Jaffray & Co. over 7,500 teens in the month of April this year, 17% were found interested in purchasing a smartwatch priced below $350. The upcoming large-screen iPhone 6 is likely to attract more teenagers as the smartphone serves more purpose than a smartwatch. An iWatch or any smartwatch is likely to attract more fitness fanatics than the average user. Despite, the initial sales of iWatch are expected to reach 5 million only.

The Fitbit Connection

Of all the respondents who polled for the survey, 18% already owned a wearable band while 13% are likely to buy one next year. Of all the bands, Fitbit emerged as the favourite among the users. This is unsurprising since Fitbit hogged the wearable band market in Q1 2014. Interestingly, almost one-third of respondents are likely to wear both the fitness band and smartwatch at the same time, thereby proving that the trend of fitness bands is not likely to die soon. This trend will help the smartwatch industry to achieve the estimated shipment to 373 million units by 2020.

Attendees At Google I/O Conference Gifted Two Smartwatches!

The growing market trend towards smartwatch industry was clearly visible in recently held Google Inc. (NASDAQ:GOOGI/O Conference 2014. The developers, who attended the conference, were in for a treat as they were given two Android Wear smartwatches – an option between Samsung Gear Live or LG G Watch and Moto 360 that would follow in coming days. The features of Android Wear, modified Android OS for wearable gadgets, were displayed in the conference. Apart from the standard weather notifications, time, maps, the Android Wear is able to perform navigation for bicyclists and walkers. In addition to that, a few third party apps were also displayed at the conference. However, smartwatch is still far from acting as a standalone device and the majority of controls are driven through smartphones; the smartwatch is just a tiny projection of the smartphones.

android wear developer preview

The event has officially kicked-off the competition in smartwatch market, especially against iWatch. While Apple will follow its traditional process of controlling the complete ecosystem of a device, including OS and apps, Google will present stiff competition by empowering other vendors smartwatches with Android Wear. Google’s strategy to target the industry as a while, irrespective of vendor and manufacturer, has performed exponentially with smartphones. Nearly 80% smartphones are powered with Google Android OS. Though Samsung and Microsoft are trying to control the growing influence of Android by introducing Tizen and Windows Phone 8 OS but fail to posses any immediate threat to Android that has taken distinctive lead.

The smartwatch adoption is likely to increase in the developed countries more. However, the cost of wearable gadgets will play an important role. With a plethora of options available, the users are willing to make more informed choices and go for products that fit in their budget. Even the teenagers making their first purchase are likely to spend their money on a well priced smartwatch.

Advertisement

35% Of Apple Inc. (AAPL) iPhone 6 Buyers Are Willing To Ditch Android !

5

The launch date of Apple Inc. (NASDAQ:AAPL) iPhone6 is yet to be finalized but its share of surveys, reports and speculations are unstoppable. The smartphone market is abuzz with the discussions whether the new iPhone 6 could capture a sizeable chunk from the Android-powered, large-screen smartphones. A survey conducted by RBC Capital Markets on 4,000 people found out that 23% of the respondents are likely to purchase an iPhone if it came with a larger screen size. Moreover, 35% of future or current Android users are also willing to make a switch in favour of large-screen iPhone 6.

Apple iPhone users willing to buy

Users Willing to Pay $100 Extra For Larger-Screen iPhones!

The brand value of Apple is so strong in the smartphone market that users are willing to shell $100 extra for a 5.5 inch iPhone6. Out of the 706 participants who answered the question, more than one-fourth users are willing to pay $299 as down payment (with contract) for 5.5 inch iPhone 6.

apple iphone 6 buying porpsctes

The desire for larger screen phone reverberates with the user as 64% opted for larger iPhone 6. Interestingly, one-fifth of the respondents who took this question still opted for a free iPhone 5C with contract. This is unsurprising since huge price tag is preventing users to go for Apple iPhone. The declining market share of Apple in global smartphone market can be attributed to this. On the other hand, the Android-powered smartphones have flooded the market by satisfying all price range and screen sizes, thus giving users a myriad of options to choose from.

Interestingly, more than one-third of users chose a 4.7 inch iPhone 6 instead of 5.5 inch. Bringing a smartphone in the screen size between 4.5 and 5 is likely to be more beneficial for Apple as it carries a handling comfort, thus preferred by majority of respondents. However, most of the leading smartphone OEMs have placed their flagship models in the screen-bucket of 5-inch or bigger, be it Samsung Electronics Co., Ltd. (KRX:005930) or HTC Corp (TPE:2498) or LG Electronics Inc. (KRX:066570). The Samsung Galaxy S5, LG G2, HTC One M8 feature 5.1 inch, 5.2 inch, 5.0 inch, respectively. Despite, It is unlikely that iPhone 6 will face a strong competition from the above mentioned flagship smartphones.

35% Respondents Resist iPhones Due To High Price Tag

Most of the avid smartphone users are aware of the fact that Apple introduced an upgraded version of iPhone once a year. Therefore, 40% respondents have claimed that they are waiting for the impending update later this year and are willing to switch once the new iPhone is available in market. Users look out for variety of features while upgrading including larger screen size, battery life and processor speed. However, out of the 1,427 respondents to the question related to price, 35% claimed the price-tag is the most important factor while buying an iPhone. Beyond the price, the users made well use of the ‘others’ section and listed a longer battery life, screen size and better camera in their top priorities.

people not buying iPhone 6

Lately, Apple is facing stiff competition from companies like Samsung and few other local vendors whose have made their smartphones available satisfying almost every price range. The only salvation for Apple is the brand-value and respect, which the company enjoys the most in the high-end device market. Considering the fact that more than one-third of smartphone users are willing to switch from Android smartphones to iPhone, Apple may be look further to make few more tweaks to its pricing strategy. Apple might lose some old users who are not willing to jump from 4 inch iPhones to 5.5 inch iPhones but it sure might gain some new users who have long been waiting for iPhone but were restricted due to small screen size.

Advertisement

Health And Fitness Apps On Apple Inc. (AAPL) iOS Outpaced Overall App Usage Growth In 1H 2014 !

0

In comparison to the overall app industry which grew by 115% in daily usage, health and fitness app industry registered a growth of 49% in 2013. To understand the new developments, a recent report from Flurry measured the growing usage of Health and Fitness apps on Apple Inc. (NASDAQ:AAPL) iOS platform in first half of 2014. The findings were surprising enough as Health and Fitness apps has outpaced the overall iOS app industry growth with nearly 100% margin. These numbers are recorded by taking into account the usage of over 6,800 iOS apps, in a sample of 100,000 devices, listed in health and fitness category on Flurry’s platform from December 2013 to January 2014. The Flurry also goes on to define the term Fitness Fanatics – users who check health and fitness apps more than three times the average usage of such apps.

flurry avg daily app usage

62% Females are More Health Fanatics

The Apple iOS app store boasts of more than 1.2 million apps, out of which 6,800 health and fitness apps were studied that presents the changing adoption of various app types. The health and fitness app industry recorded a growth of 62% compared to 33% overall iOS app industry growth in last six months. Moreover, health and fitness app industry on iOS grew by 87% faster than the rest of app industry. The plethora of choices given by Apple fitness retail stores and seemingly easy integration go a long way in making these apps useful and famous among users. The desire to remain fit and productive encourage users to check these apps and keep updating their scores regularly.

flurry fitness gender

Out of the 48% female iOS mobile users, as against the 52% males, 62% females are more health fanatics leading to a 42% over-indexing on the female side while only 38% males indulge in using health and fitness apps. Generally, the females are more health conscious and careful about their calories and bodily intake.

Middle-aged Parents and Sports Fan Lead a Healthier Lifestyle

Surprisingly, the so-called young users between the ages of 18 and 24, registered the lowest under-indexing of 57% against the average mobile user while the people in the age group of 25-54 were found to be most health conscious. These included the parents, avid runners and sports fan. The sports fan experienced the maximum over-indexing of 80%.

flurry fitness age

Looking at the data above, it is safe to say that women in the age of 25-54 are more health conscious and in-sync with the fitness technology. The inclination of the indexes and figures might suggest ways for app developers to monetize their health and fitness apps for optimum ROI. Furthermore, the growing adoption of wearable gadgets are fuelling the growth of health and fitness app industry. Apple is rumoured to launch its iWatch later this year and considering Apple users are more app centric, there people are likely to be early adopters of wearable gadgets.

flurry fitness fanatics

Strong Growth of Health and Fitness Apps Spells Good News for Wearable Gadgets

The smartphone industry is already reaching a saturation point on the developed nations. The consumers over there are looking out for more avenues which spells a good news for vendors of wearable gadgets. With the impending launch of Apple iWatch in October, health and fitness app industry is likely to experience another boom. In addition to that, Google Inc. (NASDAQ:GOOG) reaches out to smartphone users with more than 1 million apps, out of which, a sizeable number belongs to health and fitness apps.

Companies like Samsung Electronics Co., Ltd. (KRX:005930), Google and Pebble are already reaping in good revenues from the smartwatch industry. With the introduction of Simband and SAMI, Samsung is high on innovation. The growth of wearable gadgets is in synchronization with the growth of health and fitness industry. Combining all the factors and numbers from the Flurry report, developers can try their hands at innovation to keep the users engaged.

Key Takeaways:

  • Health and Fitness apps are generating greater engagement in 2014. App developers must work on strategy to tap the growing opportunity in the industry.
  • Wearable gadget vendors as well as health app developers must target users aged between 26 and 55 years.
  • App developers should include features in their health apps more relevant to female users.
Advertisement