Home Blog Page 354

Nearly 95% Of Fortune 500 Firms On Twitter Inc. (TWTR) Follow Atleast 1 User. Brand Humanization Vital To Sustain Long-Term Association! [REPORT]

1

Inevitability of social media presence is now a fact that brand marketers across the globe must live with, but very few have grasped the main essence or meaning of the word social media and are managing their social media brand accounts in an automated or impersonated fashion. Sadly, very few marketers realize the importance of brand humanization to provide a more lively and interactive feel to brand followers or customers and pursue a long-term relationship with customers on various networking sites like Twitter Inc. (NYSE:TWTR), Facebook Inc. (NASDAQ:FB), Pinterest, Instagram and others. Brand followers, fans or customers are usually excited to engage with brands on social networking sites, hence brand humanization can play a crucial role in enhancing the user’s experience.

The micro-blogging site Twitter has variety of features which users use actively but many brand account holders fail to realize the importance of its usage. Actions on social media platforms which form a part of brand humanization hardly costs anything much for brands but the returns are quite immense in terms of loyalty amongst customers. Brand accounts need to drop down to the level of any other common Twitter user and effectively use – follow, re-tweet, favorite tweets of their customers or highlight relevant mentions by non-followers/followers on their brand pages. Twitter users are generally super excited if a big brand or famous personality re-tweets or favorites their tweet. It inculcates a loyalty factor and helps build a long-term relationship with customers.

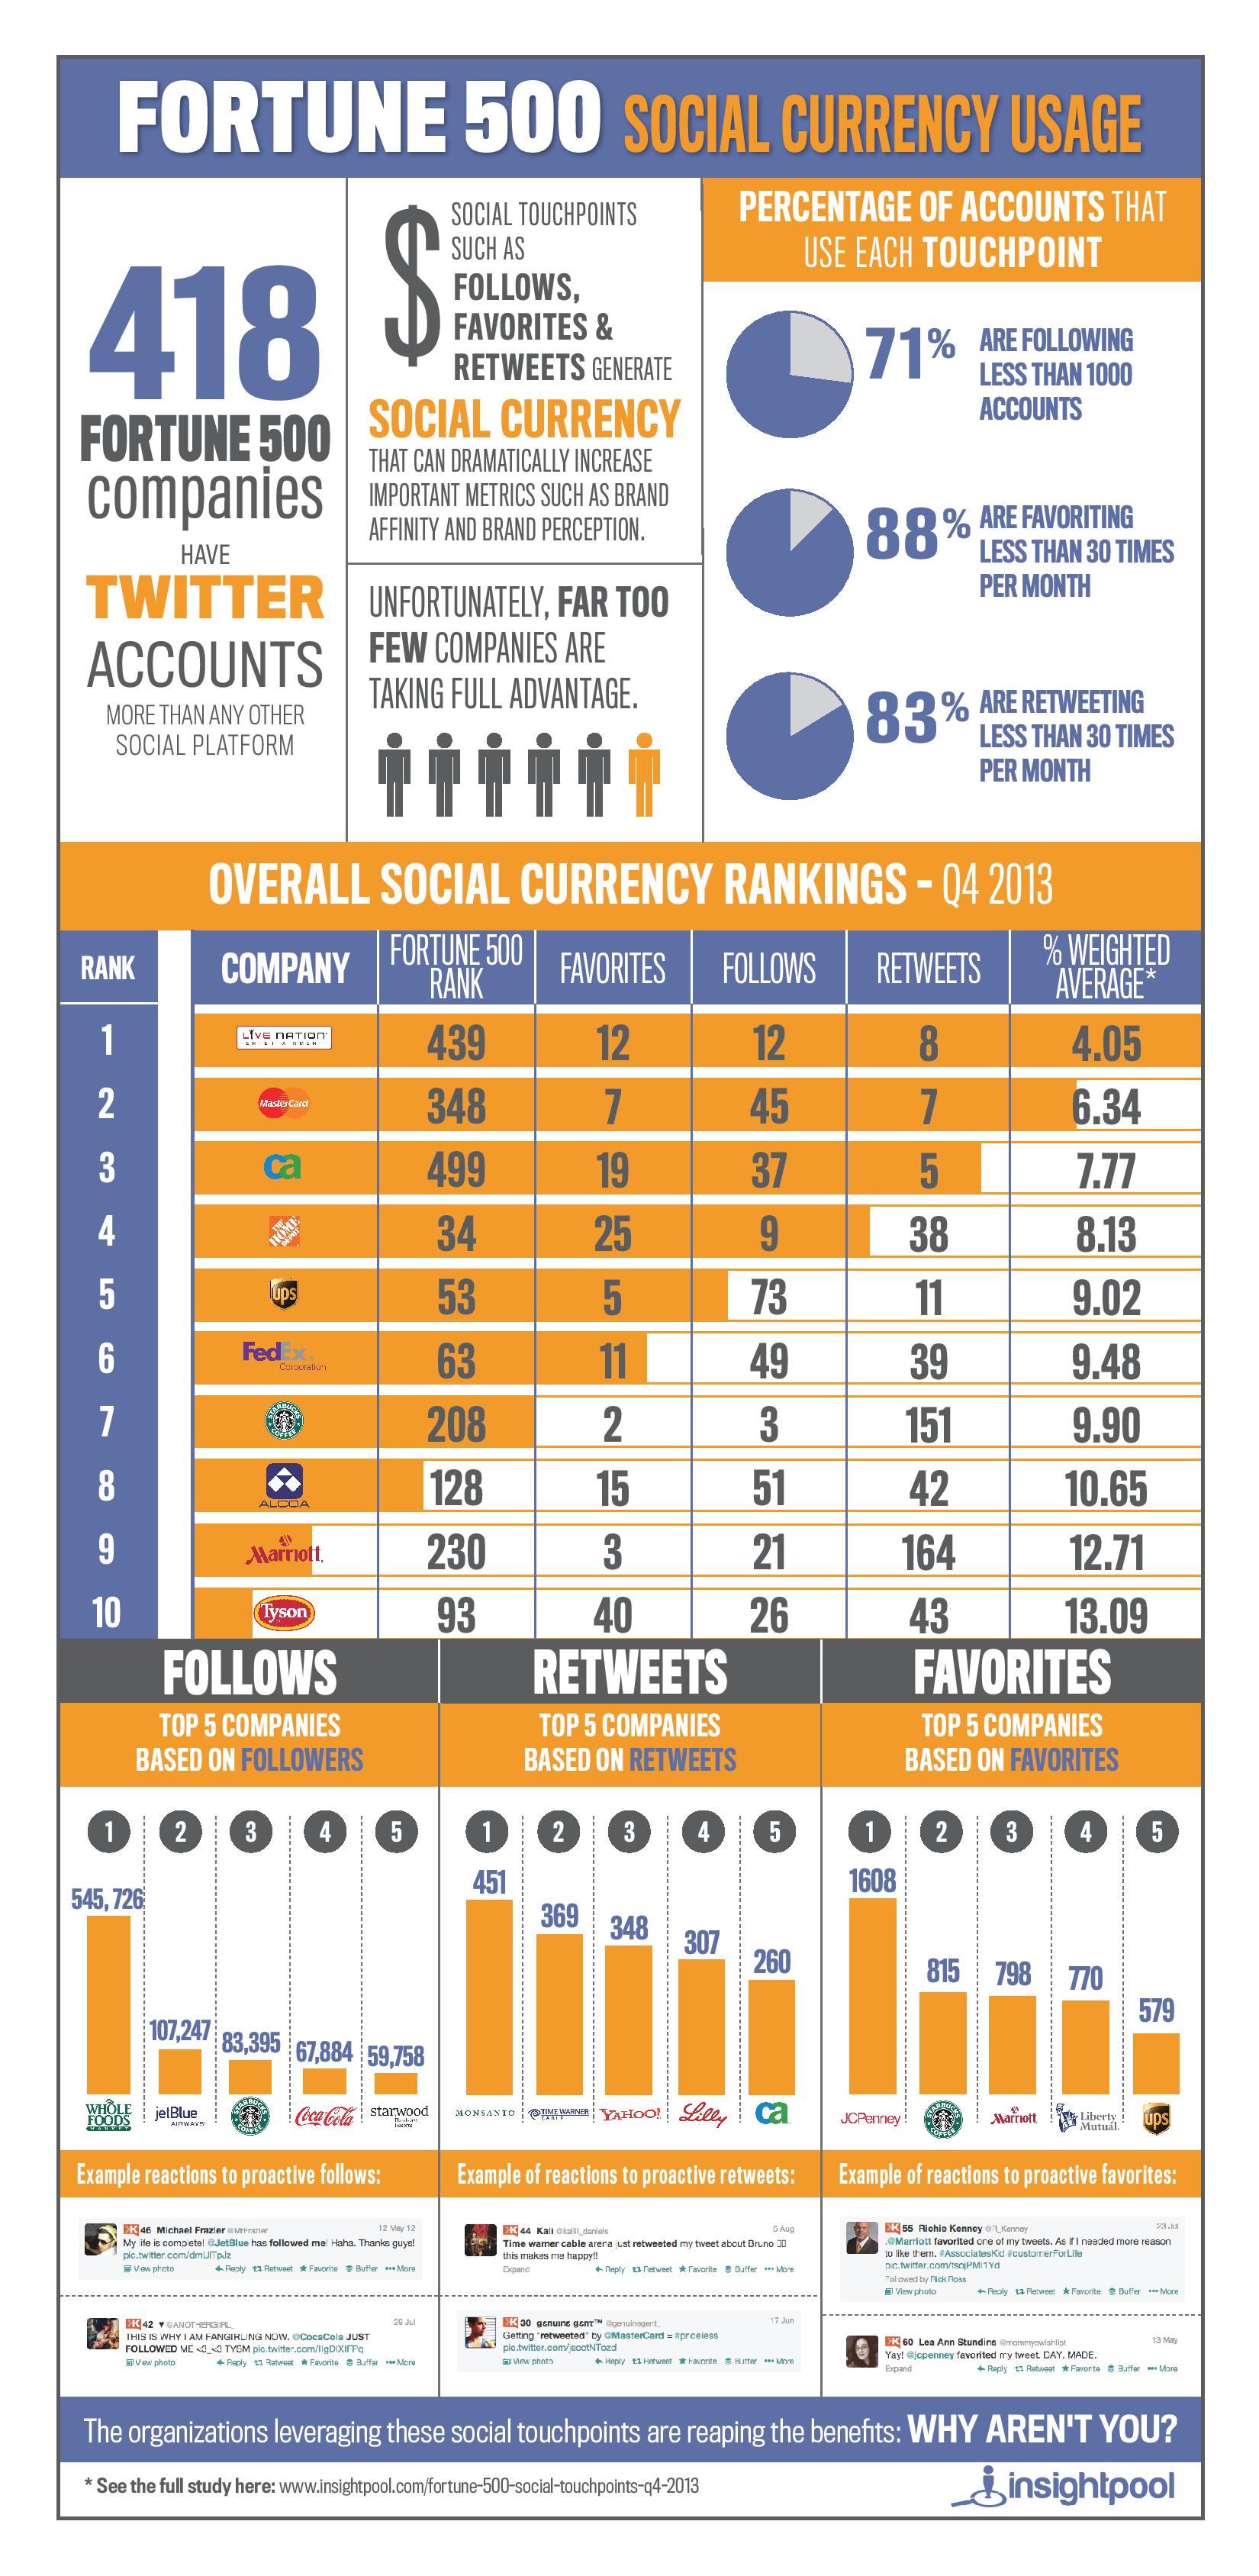
Average Amount Of Follow Per Company With A Twitter Handle Is 4,314 (Amongst Fortune 500 Firms)

Social media is called so for a reason, users including brand accounts are expected to be more social and not end up resembling media publishing firms providing only updates and product promotion stories. It is important for marketers to engage with their customers in various formats like follows, re-tweets or mentions and a lot more is available on the Twitter platform.

If we analyze the number of follows by Fortune 500 firms on Twitter, observations made were summarized as below. Nearly 95% of all companies having Twitter accounts followed at least one user. If we look at the average amount of follows per company, the tally is as high as 4,314 with Whole Foods Inc. (NASDAQ:WFM), the world’s largest U.S based retail store providing natural and organic food following more than 545,726 Twitter accounts, 500% more than any other Fortune 500 company brand account.Leading firms (fortune 500) who have embraced follow feature of Twitter

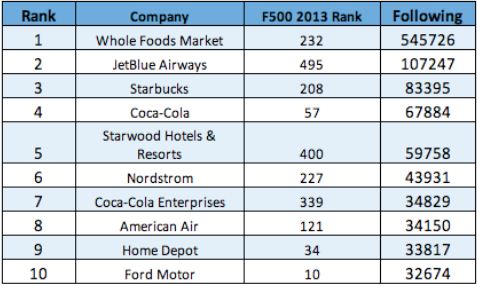
Jet Blue Corp (NASDAQ:JBLU) was next in line with 107,247 follows, Star Bucks was ranked 3rd as it had registered more than 83,395 follows from Twitter accounts. Coco Cola (67,884 follows), StarWood (59,758 follows), Nordstrom (43,931 follows), Coca-Cola Enterprises (34,829), American Air (34,150) were the other prominent Twitter brand accounts which embraced the Twitter feature follow to its best and won the hearts of their brand fans. Follow is one of the unique social impressions on Twitter which creates an effect which is much more engaging than brand awareness, it totally changes the perception of users towards a particular brand in a positive manner.Reaction of Brand customer When certain brand follows them on Twitter

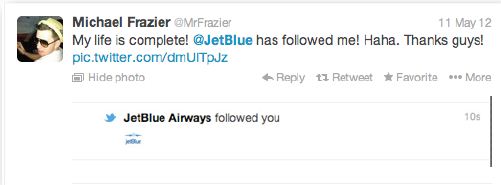
Top 10 Fortune 500 Firms Favorite 660 Tweets On An Average Per Month!

If we analyze Fortune 500 Twitter accounts based on yet another exciting brand humanization feature favorite – JC Penney Co. (NYSE:JCP), a leading cloth brand store, was at the top with 1608 favorites in the last 30 days (last 30 days, as per survey dates mentioned at the end of this article).leading Twitter firm (amongst fortune 500) using favorite feature to its best

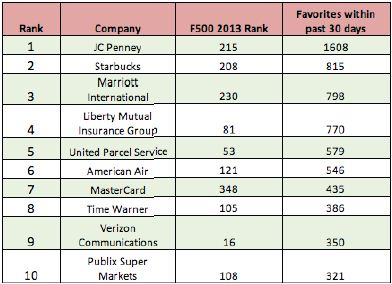
Starbucks (815), Marriott International (798 follows), Liberty mutual Insurance Group (770 follows) and United Parcel Service (579 follows) were other prominent fortune 500 firms who favorited maximum number of tweets in a span of 30 days or so. Favorite feature is much more vital than follow, as follow is just a one time activity, whereas favorite can be used repeatedly to gain traction of brand followers and their tweeps. Brand accounts must carefully utilize this feature and favorite tweets of their customers selectively as continuous usage might give a different impression and make consumers feel that the act is programmed and not humanized.reaction of consumers when some brand account favorites their Tweet

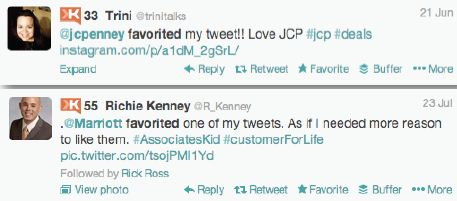
An Average Of 268 Re-Tweets In A Month Were Registered By Top 10 Fortune 500 Firms (based On The Re-Tweet Count)

Let us analyze Twitter’s most appreciated and finest feature the Re-Tweet. The list of leading firms based on their Re-Tweet activity in the last 30 days was topped by America’s well-known chemical firm Monsanto Co. (NYSE:MON) with over 451 Re-Tweets. Next in line was Tim Warner with 369 Re-Tweets, Yahoo Inc. (NASDAQ:YHOO) 348 Re-Tweets and Eli Lilly with 307. CA, ADP, Master Card and Live Nation Entertainment were other prominent firms with most Re-Tweets.leading Twitter brand accounts (amongst fortune 500 list) using Re-Tweet feature to its best

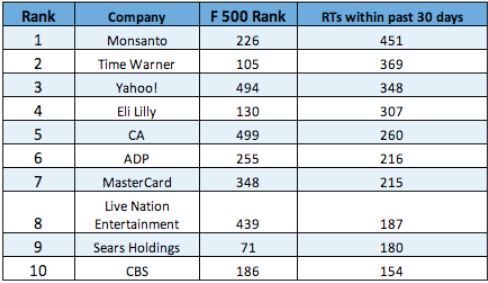
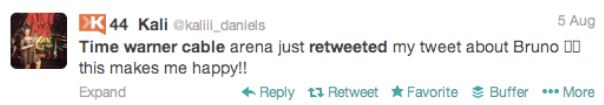
Whenever a Twitter user (including a brand account holder) Re-Tweets a particular tweet, the tweet is notified or appears in the main feed of all the tweeps for that user. Hence, it gains wide publicity or outreach. Re-Tweet is one of the most vital features of Twitter which is used by a majority of users to gain mass attention of users due to its viral nature. Brands must effectively use the above mentioned various brand humanization features to extract maximum benefits in terms of social currency from networking sites.

reaction of brand customers when brand account re-tweeted one of his/her tweets

Insight Pool had conducted this survey amongst Fortune 500 firms. The data was aggregated starting October 25th through November 3rd 2013 for 418 companies with Twitter accounts. Twitter impression which included Follows, Favorites, Retweets and Lists, was defined as a subtle action that each brand can take towards an individual.

Source: Insight Pool

Advertisement

YouTube And Twitter Inc. (TWTR) Have 30% And 37% Of Fake Following Respectively. Faking Reviews Is Now A Booming Business! [INFOGRAPHIC]

1

Creating fake profiles, increasing likes, fake followers, fake clicks, fake shares, fake reviews and fake accounts has now turned into a booming business. By 2014, more than 15% of social media reviews on various networking sites like Twitter Inc. (NYSE:TWTR), Facebook Inc. (NASDAQ:FB), Pinterest, YouTube, LinkedIn Corp. (NYSE:LNKD), Instagram, Tumblr and others are expected to be fake. An average faker has 48,885 followers and follows 1800 people. Facebook also regarded as a stalker’s favorite website, has nearly 83 million fake accounts, out of which 97% of fake Facebook profiles which identify themselves as females, only 40% of real users are so.

Spammers and other businesses providing fake reviews in various formats (based on engagement type of a particular networking site) – do so with the help of fake or inactive accounts. Whether it is re-pins on Pinterest, re-tweet on Twitter or shares on Facebook as high as a 6 digit or a 7 digit figure or even more – all of it is possible to attain via the fake reviews business. Politicians, celebrities and famous personalities are keen on building hype by buying fake reviews in the form of followers and likes on their pages. Fake followers hardly add any engagement but only increase buzz or exaggerated hype amongst the networking users on the site.

An Infographic by WhoIsHostingThis reported interesting facts and figures in the vast business surrounding fake reviews. Key points are listed below.

  • Comedians, musicians, politicians, actors and other prominent personalities are amongst the most common ones who buy fake followers and fake reviews in the form of likes, shares and re-tweets.
  • If we analyze the top 15 Twitter personalities nearly 30.4% of them have fake followers and hardly 28.7% are real.
  • Renowned celebrities like Lady Gaga, President Obama, Shakira, and Oprah are reported to have 71%, 70%, 79% and 74% of fake followers respectively.
  • Leading video content site, YouTube and San Francisco based 140 character micro-blogging firm Twitter is reported to have 30% and 37% of fake following respectively.
  • Average price for generating fake reviews in the form of followers is surprisingly inexpensive and around $10 for 1k followers. Although, the price varies from one site to another.
  • On Facebook, 20k likes average for around $699, 5k followers on Pinterest is equal to $95 and on Twitter 1 million follower amounts to $1,750.
  • 10k followers on Tumblr are equivalent to $484 monetary units, 250 comments on Blogs is charged $399 and about 100k views on Vimeo average at around $200.
  • Fake reviews like followers, likes, comments, shares and re-tweets are generated via fake accounts, hollow or inactive accounts.
  • Average age of a fake account is about 5 months and they generally have multiple followers without a profile photo.
  • About 75% of fakers are found advertising a website URL in their profile to generate more clicks or traffic.

Fake reviews business infographic

Via SocialTimes

Advertisement

8 Of The Coolest Mobile Apps For The “Internet Of Things”!

0

Estimations by the oganisation for Economic Co-operation and Development show that by the year 2020, the average household will contain 50 devices connected to the internet at any one time. Dubbed the Internet of Things, or IoT, this trend will surely continue to grow, as people are now using more apps on their Smartphones and tablets to control these appliances. Here we take a look at some of the coolest apps available which do just that.

1. XBMC (Free on Android)

This all-in-one XBMC app allows you to remotely control your TV, access music, images and video, all from your mobile device. Gone are the infuriating days of having too many remotes, and forgetting what each one is for.

2. iRule ($49.99 iOS and Android)

The iRule app is a really cool and comprehensive piece of kit which controls not only audio and video, but also lights, shades, and even security devices. The Basic iRule device will allow you to control 15 devices in your household and if you upgrade to the Pro version ($99.99), that number will increase to 25.

Top Mobile Apps for Internet of Things

3. Nest Mobile (Free on iOS and Android)

Nest Mobile allows users to adjust air temperature, and monitor smoke and carbon monoxide levels in the home. The app will tell you the different conditions in each room of the house, and will warn you if it detects anything suspicious. You’ll need a Nest Thermostat and Nest Protect Smoke Alarm to use with this free app.

4. Slideshow Remote (Free on iOS and Android)

Slideshow Remote is a handy app when giving all of those PowerPoint presentations at your board meetings. No longer do you need to stand close to your laptop or keep walking over to click the mouse pad, as this app allows you to turn your smartphone or tablet into a slideshow remote control.

5. Xtralogic Remote Desktop Client ($24.95 on Android)

With this smart app, all you need is an internet connection to be able to access your Windows laptop from your Android mobile device. The app’s interface is a mouse and keyboard, which you can use to access all of your files and emails wherever you may be.

6. The Smart Washer App (Free on iOS and Android)

If you’ve got a Samsung washing machine, The Smart Washer app will allow you to control it remotely from your Smartphone or tablet. Now, it doesn’t matter if you forget to set the machine or used the wrong temperature, as you can activate it from wherever you are sitting. The app will also allow users to find the solutions for any problems or errors without the need to read the user manual or get in touch with customer service.

7. Withings Health Mate (Free on iOS and Android)

Designed for those who wish to lose weight, commit to more exercise, improve sleep habits or keep a check on blood pressures, Withings Health Mate is a free download which works with the company’s external products like wristbands and scales. The app will improve your quality of life and keep you motivated to reach your targets during the toughest of times.

8. Koubachi (Free on iOS)

Never again will you have to go through the torment of forgetting to water your plants! This handy app (which only works with the purchase of the $99 Koubachi Sensor) will remind you when you need to water your foliage by calculating an individual care plan for each plant. It considers the plants’ water usage rate, light intensity, species and temperature. The sensor will communicate with the app keeping you informed of the status of your plants at all times!

The Guest Post is written by Ilan Nass. Ilan works for Fueled – a leading iPhone app builder, renowned for its award wining mobile design and strategy.

Advertisement

About 33% Of B2C and 20% Of B2B Firms Have Generated Revenue From Social Media [INFOGRAPHIC]

0

Brand marketers across the globe have realised the importance of various social media and online marketing techniques. But very few are able to estimate how much to invest or what are the possible returns from a particular investment, or which marketing tactic must be given preference. Nearly 85% of marketers claimed to have learnt latest digital marketing techniques through on-job experience. Marketers are investing hardly 25% of their marketing budget on online marketing and the remaining 75% is being spent on offline marketing. An infographic ‘2014 State of Digital Marketing‘ by Webmarketing depicts possible marketing trends and challenges ahead of marketers in both B2B and B2C sectors in 2014.

A few interesting facts and figures are listed below.

  • In the B2B sector, nearly 41% are expected to focus on generating leads, 27% on driving sales and about 17% in improving brand awareness amongst the masses or in the market. Marketers are likely to follow various inbound marketing techniques to generate leads as its costs 62% less per lead than traditional outbound marketing methods.
  • In the B2C arena, close to 40% stressed importance on driving sales, 27% on creating awareness and 18% in generating leads. A major share of strategy is likely to be online as a majority of consumers are flocking to various websites, networking sites and other platforms where advertising can be quite rewarding.
  • Currently, 75% of the budget invested by marketers is on offline marketing and a mere 25% for online.  About 63% are planning to focus on content and about 50% on outsourcing of search marketing.
  • About 75% plan to spend more on mobile as usage of Smartphone and tablets is on the rise.
  • One out of every five B2B marketers and one in three B2C marketers have generated revenue from social media.
  • Hardly 17% have succeeded in standardising their returns or ROI from SEO marketing, 12% in case of social marketing and 36% in case of e-mail marketing. Marketers might not want to risk their investment unless the insight of success reports from advertising on a particular ad network is clear.
  • Nearly 84% of respondents had no idea about returns from display ads and 71% had no clue about returns from SEM marketing tactics.
  • About 33% of marketers were clueless about the channel which is likely to generate most revenue and 26% were confused about the highest lead generating channel.
  • Best-in-Class, Synergy, Thought Leadership, Viral, ROI and KPI were the most hated buzzwords by marketers.

2014 State of Digital Marketing

Advertisement

More than 66% Of Internet Users In The U.K Are On Facebook Inc. (FB) [REPORT]

0

The social media titan Facebook Inc. (NASDAQ:FB) has a vast reach in the developed state of U.K with over 57% of the total population adopting the site for networking. Of the total population of 63 million odd, more than 36 million have adopted Facebook for networking. A brief demography of Facebook penetration in the U.K based on age, gender and relationship status is summarized below.

About 47% Of Facebook Population Falls In The Age Group (18-34)!

In the U.K, internet penetration is as high as 87% which means about 54 million of the total population are web users. Facebook networking users which account for 66% of the internet population in the U.K are mostly teenagers and adults in the age group – (18-34).Facebook user demography in the U.K - age wise

Below 17 years, about 2.8 million internet users are on Facebook, and in the next highest age category of 18-24 nearly 7.8 million are on Facebook. Although, the above mentioned younger generation folks below 24 years form 29% of total U.K Facebook users, few surveys reported that teens in developed states like the U.K are fleeing away due to lack of privacy on the site.

Even adults in the U.K were quite welcoming to trending networking sites like Facebook and were actively engaged in story sharing and keeping in touch with their close peers and friends. In the age group of 35-54, nearly 11.2 million users and about 4.28 million aged above 55 years, have embraced Facebook, both are together accounting for 43% of total users in the state. Although, the user-base is quite solid when compared to the total population of the state, but still, the overall charm or enthusiasm seems depleting amongst users. Facebook has to come up with some mind-boggling initiatives if it has to charm its users in developed states like the U.K.

Gender Based Facebook User Demography Is Marginally In Favor Of Female Users!

If we analyze the graph below which depicts gender wise Facebook user distribution in different age groups, females outplay males in almost every age category, by the slightest of margins. In the age group 25-34 years, about 4.6 million are female users compared to 4.4 million male users. In the next higher group which is 35-44 years, 51% or 3.2 million are female and 49% (3 million) are male. In user demography aged above 45 years, 53% which means about 4.78 million are females and 4.08 million or 47% are males. Amongst teenagers aged below 24 years, female users were 5.28 million compared to 5.26 million male users. Female users in the developed states are more open to networking, sharing and discussions on various social media sites unlike developing countries where networking sites are dominated largely by male users.Facebook user demography in the U.K - gender and age wise

Nearly 66% Of Facebook Users Were Open About Their Relationship Status!

If we analyze the graph which pictures the Facebook user demography based on relationship status, results obtained are quite similar to trending behavior amongst other developed states like the U.S. Nearly 66% of folks spoke openly about their relationship status. Close to 20.5% of total users or 7.4 million users claimed their status as single, about 1.52 million folks were engaged. Nearly 8.2 million or 22.7% of folks using Facebook in the U.K were married and 5.6 million updated their status as in a relationship. Nearly 33% of total users avoided mentioning their relationship status under their profile information.Facebook user demography relationship wise in the U.K

If we analyze the above category in comparison with age groups, hardly 25.3% of teenagers between 18-24 years hesitated to mention their relationship status, whereas more than 74% were open about their relationship status. Nearly 3 million were single, 0.34 million were engaged and 0.48 million claimed an in a relationship status in the age category mentioned above.

If we look at a higher age group, trend was somewhat similar, as more than 70% were open about their relationship status in the age group 25-34 years. In the next higher category of 35-44 years, nearly 68.75% or 4.4 million users had mentioned their relationship status along with other profile details.Facebook user demography in the U.K - relationship status wise

The Facebook user-base is currently reported to be depleting as teens in developed states are finding other niche networking sites and apps more attractive. Messenger apps have stolen the thunder from Facebook and other networking sites to a greater extent by amassing over 1.3 billion users. The social media titan needs to come up with some brain storming ideas to attract back the wayward users from the developed states.

Advertisement

‘Mobile Social Media’ Strategy : A Mantra For Brands To Ensure Success!

0

A recent survey by Adobe showed that 71 percent of tablet and Smartphone owners access social media from their mobile devices. Not only does this affect how information is being received it’s affecting how companies deliver their brand messages. The trend is a strong message for businesses to tap into the power of mobile marketing and social media, a trend that continues to increase.

More Sharing of Brand Information

Social media was once a way to share photos of kittens and videos of skateboard fails with friends and family. Now, it’s a way to learn about and share product brand information. Companies have learned the format of social media content that works best to deliver their brands. With this, Google’s YouTube is becoming an important channel for businesses.

In Q3 earning report of Google Inc. (NASDAQ:GOOG), it was announced that 40 percent of YouTube’s traffic now comes from mobile devices, up from 25 percent the preceding year. Companies are creating videos targeting mobile device users because people are more engaged with video content.

mobile social media

Verizon has its own YouTube channel called FiOS. It is built around the tag #fiosfootballgirl which stars girls in sports. They asked parents to submit videos of their daughter’s best athletic moments and created several compilations which also appear on their channel.

AT&T has a YouTube channel focused on its program called – It Can Wait. These are a series of videos that talk about how texting and driving have affected the lives of various people.

A New Type of Advertising Driven By Mobile Access

Capture the Conversation notes that mobile access of social networks has created a new type of advertising tailored to the mobile viewer. When you bring up a YouTube video on a mobile device, you’re given the option of skipping the ad. Google’s TrueView ads are more effective than full 30-second spots. A Google advertising executive says that when people perceive they have a choice to watch the ad, they respond positively.

More Mobile Means More Images

Facebook and Twitter emphasize text as the way to communicate. The mobile device market demands more image content, says Social Media Today. Forbes even states that to compete, companies will need to deliver more interesting content through images in 2014. Sites such as Pinterest, Tumblr and Instagram are rising in popularity with mobile users because of their image-centric approach to networking. As tablet and Smartphone users purchase devices that are built for viewing images and videos, the demand will increase even more.

The home improvement retailer Lowe’s has gathered a Pinterest following of almost 3.6 million with its ‘Grillin and Chillin’ campaign, notes Entrepreneur. The magazine Real Simple has hundreds of thousands of followers on multiple Pinterest boards such as ‘Doable Fitness Tips & Ideas’ and ‘Easy Hairstyles & Accessories’.

The latest trend may be about the apps available for mobile devices. The Instagram app is only available for mobile users and allows quick sharing of photos on major social networking sites. Companies can engage consumers with contests to submit lifestyle photos that highlight different uses of their products.

Advertisement

Will The Lenovo ThinkPad 8 Mark The Beginning Of The End For Apple’s iPad Mini?

2

Tablet computers or just tablets are quite the rage these days as almost every other consumer electronics company offers at least one tablet device in its product line. Lenovo (NASDAQ:LNVGY) too isn’t shying away from this trend and has announced its latest offering in the tablet computer segment in the form of the ThinkPad 8. The ThinkPad 8 is meant to be a direct competitor to Apple’s iPad Mini.

Lenovo ThinkPad 8 Tablet - Front View

Positioned as more of a business tablet and also as the best alternative to the iPad Mini (Retina), this new Windows tablet from Lenovo seems to be quite promising upon first inspection. Under the hood, it does appear as though the folks at Lenovo have upped the ante because the ThinkPad 8 comes with an 8.3 inch display bearing a resolution of 1920×1200 pixels with 273 ppi (most Windows tablets sport a 1280×800 pixel display) and an all new 2.4 GHz Quad-Core Intel Atom processor aka the Bay Trail (usually Intel’s 1.8 GHz Quad-Core unit does duty on comparable Windows tablets) and an Intel HD GPU.

It’s got a 2 GB RAM and is available with 32 GB, 64 GB and 128 GB storage capacity options. Battery life is said to stand at 8 hours but performance in real world conditions is bound to differ. As far as the cameras are concerned, there is an 8 Megapixel primary shooter and a 2.2 Megapixel secondary unit. The Lenovo ThinkPad 8 ships in with the latest Windows 8.1 OS. Apart from this, the other talking points regarding this brand new tablet are:

  • The inclusion of Micro HDMI and Micro USB 3.0 ports.
  • The omission of optional stylus support.
  • An optional QuickShot cover that can be attached magnetically to protect the screen from smudges and scratches. It also wakes up the device whenever it’s peeled back and ‘peeling back’ or ‘folding over’ the corners of the QuickShot cover that’s over the camera launches the built-in camera app. This cover can also be used as a stand whenever you want to hoist the ThinkPad 8 in a tent-like position.

ThinkPad8 Fold Down Camera Corner

On the other hand, the Apple Inc. (NASDAQ:AAPL)  iPad Mini has been around for a while now and has had a dream run at the sales charts. We saw an upgrade in the form of the all new Retina version which testifies Apple’s ethos of always offering top quality products to its customers. The iPad Mini and its Retina version are on the same page in the following aspects:

  • A 7.9 inch display.
  • A 5 Megapixel primary camera and a 1.2 Megapixel secondary camera.
  • A 10 hour battery back-up on Wi-Fi networks and 9 hours on a cellular network.
  • Voice Assistant – Siri.

However, the two differ on the following:

  • The iPad Mini is available only in 16 GB storage capacity options whereas the iPad Mini Retina is available in 16 GB, 32 GB, 64 GB and 128 GB storage capacity options.
  • While the standard iPad Mini has a screen resolution of 1024×768 pixels (163 ppi), the Retina version comes with a segment topping 2048×1536 pixel (326 ppi) resolution.
  • The iPad Mini has the A5 processor but the Retina variant gets the latest 64-bit A7 processor along with the M7 motion co-processor.
  • The former ships with iOS 6 while the latter is offered with iOS 7.
  • The iPad Mini Retina also gets a Video Zoom feature that comes in handy whilst recording videos.

apple-ipad-mini-black


Lenovo’s ThinkPad 8 will sell from a starting price point of $399 when it hits showrooms later this month, whereas the Apple iPad Mini range starts at $299 and the iPad Mini Retina display starts off at $399. While the prices of all these tablets are comparable and quite competitive, the underlying factors that sets them apart is their Operating System (iOS vs Windows) and this can alone turn out to be a pivotal point when it comes to a consumer’s buying decision.

Can the ThinkPad 8 stand out and crash the iPad Mini’s party? Or will it end up being one of the many Windows tablets out there, which have failed to do more than just slightly dent Apple’s charisma? This is something only time can answer.

Advertisement

Facebook Inc. (FB) Users In The Age Group (18-34) In The U.S., Account For 48% Of All Users [STUDY]

0

February 4, 2014 marks the 10th anniversary of the U.S based social networking giant, Facebook Inc. (NASDAQ:FB) which has amazed over 1.189 billion users across the globe with its lucrative features and networking options, grabbing the attention of brand advertisers across the globe to build a $8 billion business ($2 billion per quarter) on its networking platform.

Facebook has managed to catch the fancy of over 178 million users in its own birth place – the U.S., which is currently the leading Facebook country in the world with over 14.9% of its total user-base of 1.189 billion. The internet users in the U.S. are rather modern and irrespective of their age almost everyone from young teens to old age adults embrace the latest social media websites for networking, voice their opinions and express themselves. A few interesting trends were observed while studying the demography of Facebook’s users based on age, gender and relationship status.

 Adults In The Age Group 18-34 Years, Account For 48.31% Of Total Facebook Users In The U.S!

The U.S is one of the most advanced countries with a significant amount of internet penetration, which has resulted in vast number of web users embracing the social media networks for content sharing and interaction. Facebook by far has managed to dominate as top choice for the web users in the state.

Although, recently there were a few findings which reported a declining enthusiasm amongst the teenagers in the developed states of the U.S, alerting the social media giant about its near end. But the doomsday of the social media titan seems to be a long shot than what is being estimated, because Zuckerberg’s team is striving hard to remain dominant by innovating and copying ideas from other contemporary networks.

If we analyze Facebook’s demography based on age, nearly 9.8 million users are below the age of 17. About 23.5% of Facebook’s user-base in the U.S is formed by teens in the age group 18-24, which tally up to 42 million.  facebook demography in the U.S graph1

Adults were found equally enthusiastic as teenagers, as more than 44 million Facebook users, which means 24.7% were from the age group 25-34. Close to 32 million Facebook users (17.9% of total U.S users) were found to be in the age group of 35-44 years. Nearly 13% of the total U.S. Facebook users, which means 24 million are aged between 45-54. About 28.2 million Facebook users were above 55 years.

The noteworthy fact about the Facebook users’ demography age wise in the U.S.  is the adoption of the networking site on a wider scale in almost every single age group. Unlike developing economies like India, where 50% of Facebook users are between 18-24yrs. In the U.S, adults irrespective of their age are most welcoming and actively engage with the most widely used networking platforms like Facebook.

Female Users Marginally Outplay Males In Nearly All Age Groups!

If we analyze Facebook users demography based on age, distribution was quite fair between the 2 genders, with females marginally outplaying the males. In the age group 13-17, about 5.2 million users were females and 4.6 million were males. In the next higher age group which forms 22.4% of the total U.S user-base (25-34 yrs), male and female users accounted for 20 million each.facebook demography in the U.S graph 2

The craze of Facebook was not just limited to teens but also adults in age groups between 35-44 years, where more than 17 million females and 14.4 million male users flocked the site to share content and network with like-minded users to discuss interesting topics. More than 14.2 million female and 10.2 million male users, which totally account for 13.7% of total users in the U.S. belonged to the age group 45-54.

In the age group 55-64, 6.4 million were males and 10.2 million were females. Similar was the case with Facebook users above 65 years, where female groups yet again dominated with over 6.6 million users compared to 4.6 million males.

More Than 66% Of Facebook Users In The U.S Were Open About Their Relationship Status!

The Facebook users from the developed states of the U.S. were quite open about their relationship status. Nearly 40 million Facebook users in the U.S. were single, whereas 4.4 million were engaged. About 52 million Facebook folks were married and 22 million claimed an in a relationship status. And close to 56 million hesitated or did not bother to specify their relationship status.facebook demography in the U.S graph 3

If we analyze the age distribution in comparison with relationship status, we can observe that in the age group 18-24, more than 76% of them openly spoke about their relationship status. In the next higher age group of 25-34 years, nearly 9.6 million hesitated to talk about their relationship, whereas, the remaining 34 million, which forms 78% of the total users in the category, were open about their relationship status.

Facebook-Users-Demographic-US-Gender-Age

Although, Facebook has lost its charm in the U.S., still there is a significant group of social networking users who prefer Facebook, as it is easy to connect to every possible social media user due to its massive user-base tally of over 1 billion. Moreover, the upcoming latest features from Facebook like news feed revamp, enriching brand engagement experience through innovative ad initiatives, which displays user relevant ads, an increasing rate of informative content from media publishing firms in the NewsFeed of users and a lot more has held certain users from eradicating Facebook totally out of their daily go to websites.

The internet users in the U.S. are basically trend setters. They hardly hesitate to shift to the trending or the latest networking platforms. The internet penetration and fast adoption of Smartphone and tablets has resulted in an exponential rise in social media activity on different sites.

Advertisement

Online Video Increases Consumer’s Understanding Of Brand Products By 74%. [INFOGRAPHIC]

1

Demand for online video content by information seekers is rising at an explosive rate across the globe. People love browsing for information in the video format due to better understanding and a more apt description of the required information. Web users are increasingly browsing for video content on YouTube, Hulu and other similar services. In one internet minute (60 seconds), more than 30 hours of video is uploaded and about 1.3 million video views are registered on the leading video content site YouTube.

Online video streaming services like Netflix and YouTube account for nearly 50% of downstream traffic in the U.S over fixed networks. At a global level, a user spends on an average 1,177.3 minutes on various online video properties owned by top sites like Google Inc. (NASDAQ:GOOG), AOL Inc. (NYSE:AOL), Facebook Inc. (NASDAQ:FB) and others. Brand marketers must focus on including well designed cheeky videos along with the brand content to drive better engagement rates. Adoption of various services like Instagram video, Vine, YouTube and others might prove to be rewarding for brand marketers.

According to an Infographic by Quicksprout which summarized certain key facts and figures pertaining to the online video industry, videos increase people’s understanding of brand products by 74%. Couple of other interesting stats are listed below.

  • The undisputed king of video content, YouTube is the 2nd largest search engine after the search giant Google, with over 3 billion search queries per month, signifying the rising demand for video content by information seekers rather than information in text format.
  • Nearly 45.4% of internet users view at least one video online in a month, and on an average, a user is exposed to at least 32 videos per month.
  • In a day, 100 million internet users watch online video and a majority of them watch videos that offer a product or service related information.
  • About 75% of executives watch work related videos on business oriented websites, at least once a week.
  • About 50% of them watch business related videos on YouTube and about 65% of them visit the marketer’s website after viewing the video.
  • An average user spends 16 minutes and 49 seconds watching online video ads every month.
  • Close to 80% of internet users remember the online video ads which they might have watched and about 46% take action after viewing the ad. About 26% of them look for more information, 22% visit the website named in the ad, 15% of them visit the company representative and about 12% purchase the product featured in the ad.
  • Website visitors are 64% more likely to buy a product after viewing an online video ad than the ones who have not watched the video.
  • Real estate listings with videos receive 403% more inquiries than those without videos.
  • Demographics hardly matter for video viewing, online users between ages 35-44 and 45-54 are just as likely to browse for video content as online users in the age group 18-24.
  • Click-through-rate is 2X-3X higher when marketers include a video in a marketing email. This also leads to a 75% decrease in subscription opt-outs by brand followers.

infographic online video market

Advertisement

Social Ads Spending 2014 : North America Tops With $32.82 Per User. In Asia-Pacific A Mere $3.60 Is Spent Per User! [REPORT]

0

Social ads’ spending is on the rise across the globe with increasing usage of social networking sites by web users. In 2014, content sharing on social media sites is expected to rise to a massive 32 billion items per day, a 700% rise when compared to 2011 content sharing figures of 4 billion items per day. People are increasingly embracing various social media sites like Facebook Inc. (NASDAQ:FB), Twitter Inc. (NYSE:TWTR), LinkedIn Corp (NYSE:LNKD), Pinterest and Instagram on desktop and mobile platforms. Compatibility of a majority of the above websites on mobile phones and tablet devices has led to a rise in mobile social media users. Increasing levels of engagement on various networking sites has tempted a majority of advertisers to spend heavily on various forms of social ads. Advertisers are competing to drive their well designed marketing content to user’s main feed and drive engagement of desired form.

North American Advertisers Spend 240% More Than Advertisers From The Next Closest competing Region!

According to a well-known measurer of digital trends eMarketer, advertisers from North America are expected to spend $32.82 per user on social ads in 2014, which is 240% more than the next closest competing advertisers from Western Europe, where social ads spent is likely to be around $13.71 per user. Although, social networking site adoption in developing economies of Asia-Pacific and Africa is increasing at an exploding rate, still advertisers are not ready to invest a major share of the marketing budget on social ads. Average social ads spending worldwide per user in 2014 is estimated to be around $6.97, an increment of 12.78% compared to the 2013 tally of $6.18.social ad spending per user worldwide

Social ads’ spend drops off significantly after North America and Western Europe. In Asia-Pacific, advertisers are expected to spend $3.60 per user on social ads, an increment of 7.1% compared to 2013. Advertisers from the Middle East and African regions are estimated to spend $0.50 on social ads per user basis.

Social networks are driving a significant amount of returns to advertisers by driving brand followers to a brand’s website. According to a report by shareaholic, Facebook’s referral rate spiked up by 170% in the last 1 year. People are increasingly engaging with various brands on Facebook, Pinterest and Instagram. Nearly 48% of shopaholics prefer social media to plan for holiday shopping. Facebook is known to drive 60% of shopping traffic for retail websites. Even at the mobile level, Facebook has fared well by a record increase in referral rate by 253%. RPV (revenue per visitor) on Facebook saw an increase of 38% from $0.67 to $0.93 and is now the highest amongst social networking sites.

People are sharing content and discussing about their favorite brands and their shopping experience on various networking sites. More than 80% of content on Pinterest website is shared content in the form of re-pins, number of shares on Facebook increased by 94% in last 1 year, twitter registers nearly 5700 tweets per second – these figures depict the level of addiction the web users have towards networking sites. This has greatly influenced brand advertisers to market their content on various networking sites.

2014 Social Ads Spending Growth Rate Estimated To Be Highest In The Middle East And Africa At Around 64%!

Social network ad spending is expected to grow by leaps and bounds in the Middle East and African regions as the advertisers are slowly grasping the various social marketing tactics and their importance. Advertising innovations by various networking giants has provided an opportunity to materialize growth rate as high as 63.9% in the Middle East and African regions. Latin America and North American advertisers are expected to increase their social ads spent by 37.6% and 30.7% respectively. In Asia-pacific, advertisers are likely to increase their social ads spend by 22.6%.social ad spending growth rate worldwide

Social networking sites are toiling hard to make the platform advertiser friendly and aid them in deriving desirable results for the funds invested. Pinterest with its unique pin board style photo sharing has taken the e-commerce arena by surprise, accounting for 17.64% of e-commerce revenue (in the U.S, April 2012) from social media sites. According to yet another report by Adobe, Pinterest recorded an emphatic growth of 150% in RPV (Revenue per visitor) from $0.22 in 2012 to $0.55 in September 2013. The 140 character service, Twitter too surged by 300% in RPV from $0.11 to $0.44. Facebook, Pinterest and Twitter collectively drive about 15.22% of overall traffic to brand websites in the last 1 year.

Largest professional networking site LinkedIn is the undisputed king of referrals to corporate websites with 64% share. An average Facebook user spends close to 8.3hrs per month and logins at least 13.8 times a day (on his mobile). In one internet minute, nearly 277,000 Facebook logins occur, 100+ LinkedIn accounts are generated and about 1.3 million video views are registered on the YouTube site.

Advertisers are undoubtedly amazed by social media activity of web users in certain parts of the globe. This has persuaded many to levy their trust on social ads and invest more. A vast summary of stats and figures summarized above must be smartly used by brand advertises to allot marketing budgets for social ads and market their content effectively. Social media sites in an unavoidable and must-adopt platform for brand advertisers.

Advertisement

Is Apple Inc. (AAPL) Cupertino Based Spaceship Campus Far-Out ?

1

Apple Inc. (NASDAQ:AAPL) isn’t just working hard to deliver ultra-advanced products for its customers, but it is also trying to be a pioneer in other areas. This may explain why they’re developing a futuristic new base for the comfort of their employees. Apple’s Spaceship campus or Apple Campus 2 is a new model for the 21st century workplace. After all, the rumors and consistent online chatter about the proposed new headquarters (which the late Steve Jobs equated to a spaceship), the project has received unanimous approval from the Cupertino City Council, and construction is now set to begin.

The Mothership

The campus is an integrated, unified and secure creation that is designed for research, collaboration and innovation. The project is set to break ground in 2014, being completed in 2016. The plans consist of close to 3.5 million square feet of office space, 10,500 parking space, a fitness center, as well as a 1,000-seat auditorium.

Apple Inc Spaceship Campus

The main building, which is four stories high and ring-shaped, will contain 2.8 million square feet of space and accommodate 12,000 of the 16,000 Apple employees in and around Cupertino.

The majority of the 176 acres will be occupied by greenery, but the jewel of the campus will be the glimmering ring of polished metal and glass.

Though the donut-shaped building is the star attraction, it is not the only place to find Apple employees. There will be a small cluster of luxurious buildings on the southern edge that is reserved for its Research and Development department.

Apple Amenities

The design of the campus is intended to promote collaboration and creativity. The building’s secure landscape extends and connects the interior workspaces with the outdoors, enabling relaxation, reflection and recreation in an effort to spur invention of Apple’s next generation of products.

Apple is building the campus with specific objectives:

  • Promote employees productivity by providing superior quality on site amenities
  • Provide a venue for the Worldwide introduction of new products
  • Create a campus that is in line with Apple’s business and design practices

For employees, a single security point on the west edge of the site will be the point of entry, which diverts those lucky few into a futuristic tunnel with a subterranean service road, which leads to a two-level parking garage underneath the building.

Employees without cars will take advantage of the Apple shuttle buses. These drop you off at the eastern edge of the site in what is known as the Corporate Transit Center, a walkway flanked by two Apple-white staircases leading you into the mothership itself.

Apple workers will have access to a 90,000-square-foot cafeteria, in which they will be able to stroll in and out of the ring to an orchard with a cluster of apple and apricot trees.

The facility is just as cutting edge as the gadgets Apple makes and will run entirely on renewable energy. Its power will rely mostly on rooftop photovoltaic arrays as well as on-site fuel cell plants.

There’s no doubt the vision and design of this project will create a truly beautiful, peaceful place to work and create, and for $5 billion you’d expect no less.

 The Guest post is written by Fueled, a mobile app development company and award winning iOS app developers.

Advertisement

92 Million Facebook Users Make India The Second Largest Country [STUDY]

0

Although the social media titan Facebook Inc. (NASDAQ:FB) has started to lose numbers in developed states, it is performing exceedingly well in developing economies like India, Brazil, and other Asian, African, and European countries. The increasing internet penetration in India, combined with the lucrative Facebook features, has led to a surge in Facebook adoption for social networking among web users. The number of Facebook users in India has reached 92 million, making it the second largest after the United States, according to Facebook’s own data.

Earlier in August 2013, India had surpassed Japan to become the 3rd largest internet population with 74 million web users after the U.S. and China. According to another report, more than 97% of internet users in India were predicted to access Facebook. By June 2014, the total number of internet users tally is expected to reach 243 million in the sub-continent (India), of which more than 185 million are likely to access the web through their mobile devices. Hence, Facebook adoption is bound to rise further in the near future both at mobile and desktop levels.

Teens Aged 18-24 Account For 50% Of Total Facebook Users In India

Facebook user base age wise graph1

Although internet users in India are aware of various social networking sites, very few of them bother to browse through sites other than Facebook. Not just in India, but in a majority of other developing economies, web users are increasingly using Facebook, as the social media usage timeline is slightly lagging in these states. In India, a majority of teens have flocked to the social media giant’s website and use it vastly for sharing stories, voice opinions, discussions, brand engagement, and other activities. 

Of the total 92 million (7.73% of the total user-base) Facebook users in India, nearly 50% of them belong to the age group 18-24 years. Facebook is clearly at an infancy stage in India and other similar developing countries. Hence web users especially teens find it exciting and are very active on the site. Nearly 11% or 10.6 million Facebook users in India are aged below 17, and about 26 million (28% of the total Facebook India population) fall in the age group of 25-34. Close to 6.6 million are between 35-44 years, 2.2 million between 45-54 years, and the rest above 55 years.

Facebook usage is expected to rise further in India, creating a Facebook profile, uploading it with thousands of photos, updating status or check-ins of some of the famous places to visit, and posting pictures with some celebrities have become fashionable in India. Female users are busy changing their display and timeline picture at a rate faster than the time taken to load a web page. Male users at the same time are busy stalking all pictures and goofing them up with some meme theme and provoking discussion threads. Although the younger generation is dominant, even adult groups are taking to the site due to its exciting features and to use it as a mode of remaining in touch with their children and close peers.

Male Users Dominate, Accounting For 75.6% Of The Overall User Base!

If we compare Facebook user demography based on gender, nearly 75.6% of the total user base in India, which means nearly 69.5 million users are male, whereas close to 22 million odd are female users. In the age group below 17, male users account for 8 million (8.6% of the total user base in India) and females for 2.6 million. Amongst teens of age between 18-24 years, nearly 34 million or 37% of users (In India) are male and about 11.6 million are female users.

facebook user base age and gender graph2

Even in higher age groups, male users dominate, outplaying female users by a significant margin, amongst users aged 25-34 years 19.8 million (77.3% of users in the mentioned age category) are male compared to 5.8 million who belong to the female category. Amongst user aged 35-44, 77.39% (5 million) are male, and the rests (1.46 million) are female.

Nearly 52% Of Indian Facebook Users Hardly Bother To Mention Their Relationship Status!

facebook user base relationship status graph3

According to the demography of Facebook users based on their relationship status, it has been revealed that a majority of them hesitate to mention their relationship status on the networking site. More than 52% of Facebook users in India, which means about 48 million users hardly bother to mention their relationship status. 

Close to 26 million users claimed themselves as singles and 0.78 million engaged. Nearly 8.6 million Facebook users had updated their status as married and about 3.6 million as – in a relationship.

If we combine age-wise distribution along with relationship status-based demography, a couple of interesting observations are revealed. Amongst the teens in the age group 18-24, nearly 19 million users had updated their status as engaged, and 2.2 million said that they were in a relationship, at the same time more than 22 million which is 47% of the overall users in the specified age group preferred not to reveal their true relationship status. Generally updating relationship status seems fancy to younger generation groups than the higher aged adult group.

facebook-users-india-2013-gender-age

As the age group moves higher, the enthusiasm of Facebook users in mentioning their relationship status decreases. In the age group 25-34 years, 52% of users in the group, or 13.6 million had not specified their relationship status under their profile information. In higher age group categories of Facebook users in India, the share of ‘not specified’ relationship status is dominating compared to the rest.

The user base of Facebook is bound to rise further in India and other developing countries as the internet penetration rate is surpassing new heights on a Q-O-Q basis. It would be interesting to see how far the social media titan continues to withhold the title of No.1 networking giant amidst the tough competition from other networking users.

Advertisement

Over 107 Million MNP Requests Were Made In India By October 2013, Karnataka & Rajasthan Lead!

0

Nearly 2 years after its primary introduction, wireless cellular subscribers in India are taking great advantage of MNP (Mobile Number Portability) facility. TRAI (Telecom Regulatory Of India) has recently released a report which summarizes the telecom subscription data in India. According to this report, MNP requests in India increased from 102.49 million in September, 2013 to a staggering 104.79 million by the end of October, 2013. Around 2.30 million cellular service subscribers made mobile number portability requests in the month of October, 2013 alone.

MNP Request-TRAI-Oct-2013

Clearly, with a charge of just Rs. 19 for raising an MNP request, Indian subscribers are finding it easier and compelling enough to switch to a better service provider. As per the available data, Karnataka leads the number in receiving the highest number of MNP requests at 12.06 million. Rajasthan, with 10.44 million requests and Andhra Pradesh, with 9.52 million requests, stand at second and third positions respectively. With around 9.09 million portability requests, Gujarat stands at 4th position in this regard.

Wireless Telephone ISP India-Oct 2013

Bharti Airtel grabbed the highest number of net wireless & wired telephone subscriptions in October, 2013. With a market share of 22.60% and for the same month it also stands as largest cellular service provider in India.

Private wireless service providers now hold a staggering 88.41% market share while the PSU service providers combined [BSNL + MTNL] are now left with just 11.59% market share. As of October 2013, Airtel is India’s largest wireless service provider with 22.26% market share as it also managed to attract the maximum number [1.48 million] of subscriber additions. Both, Vodafone and Idea Cellular managed to grab around 1.15 million new wireless subscribers, while Aircel and Reliance too managed to attract new subscribers, but not many in comparison. Videocon and HFCL [acquired by RIL] managed to achieve highest monthly growth rates of around 7.40% and 5.79% respectively. On the other hand, Unitech, Tata and MTNL lost subscribers to other service providers in the month of October, 2013.

Wired Telephone India Oct 2013

On the whole, there was a monthly growth rate of 0.56% [4.9 million] in wireless subscribers in India. India has now reached to 70.96% tele-density, up from 70.63% in the month of September 2013. Although urban wireless subscribers have declined from 59.75% to 59.65% at the expense of the rural population, who are joining the cellular ecosystem faster than the urban population. Of all the wireless subscribers in India 40.35% belong to the rural population, an increase from 40.25% in September 2013.

Wireless Broadband India October 2013

Wireline telephone subscriber market share is still lead by PSUs, BSNL [65.83%] and MTNL [12.18%], although according to the numbers, they are fast losing subscribers to private service providers like Bharti Airtel, Tata and HFCL.

By 31st October, 2013, the top 5 broadband internet service providers in the country include BSNL (9.96 million), Bharti Airtel (1.32 million), MTNL (1.11 million), Hathway Cable (0.37 million) and Beam Telecom (0.34 million). As a reminder, an internet connection in India is termed as broadband if and only if it provides a minimum download speed of 512 Kbps.

Source: TRAI Report, December 2013

Advertisement

Nearly 83.6% Of Fortune 500 Firms Have Adopted Twitter Inc. (TWTR)! Social Currency Index Is A Decisive Factor In Measuring Twitter Marketing Efforts! [INFOGRAPHIC]

4

San Francisco based 140 character firm, Twitter Inc. (NYSE:TWTR) has topped the social media news section in second half of 2013, with its historic IPO debut. Its growth potential was the most talked about and investors had showed confidence in it. Twitter, with its unique customs and traditions like Retweets, Favoriting, Following and viral nature has enacted as a  prolific information network which a majority of brands fail to realise. Brand firms using Twitter smartly are gaining significant returns. It is vital for brand marketers to get acquainted with tricks and tactics of Twitter marketing and use the platform to gain maximum benefits.

Leading  social service provider InsightPool had conducted a study based on Fortune 500 firms’ Twitter activities in an Infographic. Few interesting findings are listed below –

Social currency is defined as garnering of returns in terms of brand visibility, brand perception and brand affinity garnered by a Twitter brand account via engagement formats such as Retweets, Favoriting, Following and a lot more.

  • Nearly 83.6% of Fortune 500 firms have Twitter accounts which is the highest compared to the adoption of any other social media site by Fortune 500 firms.
  • Social touchpoints such as Follows, Favorites and Retweets which generate social currency and lead to an increase in brand affinity and brand perception is adopted by very few of the Fortune 500 firms on Twitter.
  • Nearly 71% are following less than 1000 accounts and about 88% of them favorite less than 30 times a month. The engagement must be higher such that the firm’s Followers get a feel of person-to-person interaction.
  • Hardly 83% are Retweeting less than 30 times a month. More engagement in the form of Retweet, Favoriting and Following is important as the followers are less doubtful about impersonation of the firm’s social media account.
  • Well-known American entertainment company Live Nation Inc. (NYSE:LYV) was ranked number one in terms of social currency rankings in Q4 of 2013. These rankings were given based on the firm’s Twitter engagement rate in the form of Retweets, Follows and Favoriting.
  • Master Card (Fortune 348 firm) was the second highest ranked amongst top social currency index firms. The Home Depot, UPS, FedEx Corporation, StarBucks Coffee, ALCOA, Marriot and Tyson were other prominent firms with significant social currency indexes in ranking order as listed above.
  • Whole Foods Inc. (NASDAQ:WFM), the world’s largest U.S based retail store providing natural and organic food was ranked number one (in terms of fan base) with 545,726 follows.
  • Jet Blue was next in line with 107,247 follows, Star Bucks was ranked 3rd as it had more than 83,395 followers or Twitter users. Coco Cola (67,884 follows) and StarWood (59,758 follows) were 4th and 5th respectively.
  • Top 5 companies based on Retweets are Monsanto with 451 Retweets, Time Warner with 369, Yahoo! with 348, Lilly with 307 and CA with 260 retweets. Twitter users were quite excited and had a positive impact (in favor of the brand) when their tweets were Retweeted by the firm’s Twitter accounts.
  • Top 5 amongst Fortune 500 firms, based on Favoriting activity of users/followers’ Tweets by the brand on Twitter are JCPenney with 1608 Favorites, Star Bucks with 815 favorites, Marriott with 798 Favorites and Liberty Mutual with 770 favorites.

infographic twitter for fortune 500

Source: Insight Pool


Advertisement