Home Blog Page 323

Facebook Inc. (FB) Beaten By Instagram In The Consumption of Social Media !

3

Although Facebook Inc. (NASDAQ:FB) has been the undisputed king of online social media among all the age groups, but taking in specific the case of the young users, it is no longer the most preferred social platform for them.

With 87% of the total population on the Internet, the percentage of the total US population accessing Internet has almost doubled up from the starting of this millennium and arriving to this year of 2014. The main factors behind these expanding realms of the cyberspace in the American continent can be attributed primarily to the elimination of the limitability of the net access to a particular stratum or age group and secondly also to the availability of newer mobile devices for going online which has certainly eased the reach of this global connection to one and all. The main profiteers of this “internet user revolution” have been the social media platforms and the reason behind this is not very arduous to guess because the highest growth in the user base of the WWW consortium has been perceived in the age group of teens who basically access the Internet to log on to their social network accounts or view a video on YouTube, for either increasing their knowledge quotient or solely for entertainment purpose.

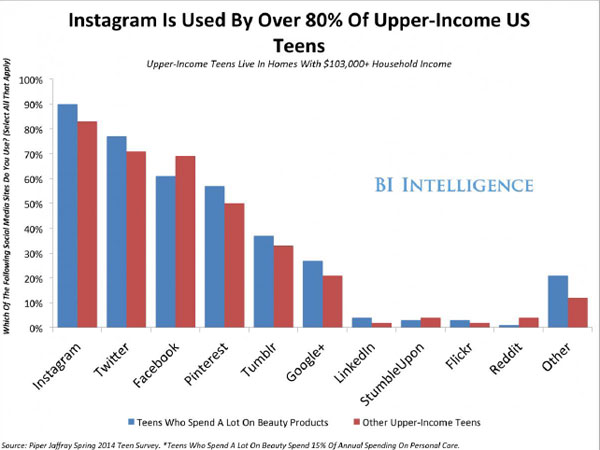
Instagram becoming the most preferred social network for teens

According to a new report published by the BI intelligence, Instagram has now become a more prominent social platform among the teens as compared to Facebook and Twitter Inc. (NYSE:TWTR).

Instagram superseded Facebook in extending its reach to upper-income teens with 83% of them engaging on this social photo-sharing platform, and hence it proving to be a lucrative marketing channel for the youth-centric brands. In totality 80% of the users between 12 and 24 years used Facebook, 53% held an account in Instagram, 46% of them used Snapchat and next to follow in this trend were Twitter, Google+ and Vine with 36%, 34% and 30% share, respectively.

instagramprestige2

The photo-sharing pulpits have always been dominated by women and Instagram is also not an exception to this convention with 68% of its users being women. But lately men have also become too active on this platform with every six out of 10 Instagram users being men hence narrowing this gender gap significantly.

Owing to this tremendous success of Instagram, the Facebook-Instagram deal in 2012 has really turned out to be an aggrandizing accord for Zuckerberg.

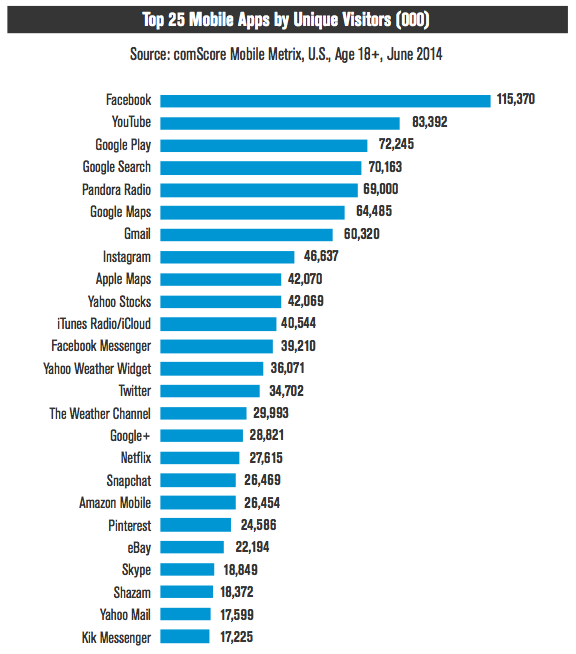
Increasing reach of YouTube among the 18-24 age group

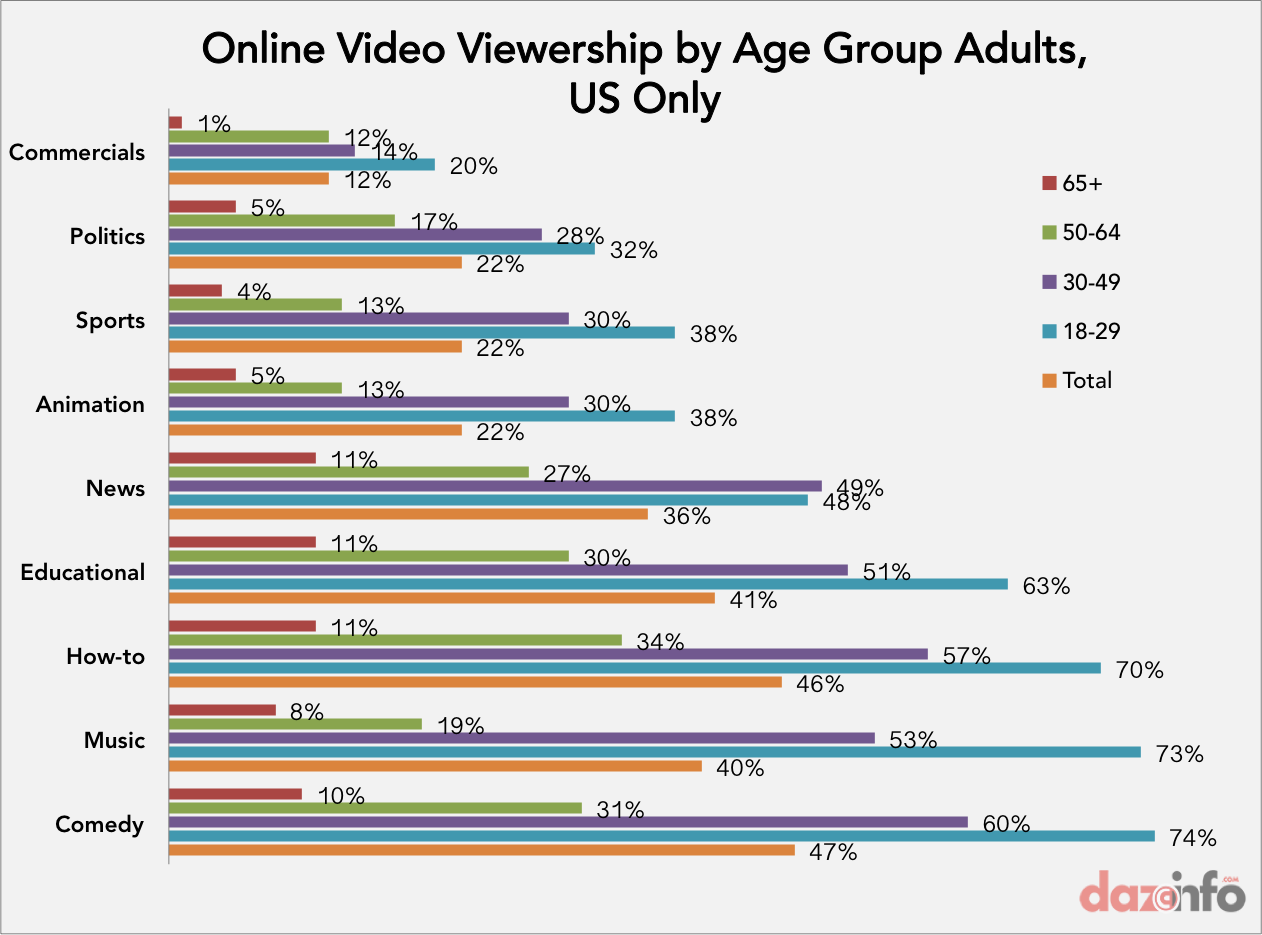
Americans with the passage of time are becoming increasingly comfortable using technology in ways that take advantage of the strengths of each medium and each device. YouTube has been one of such mediums which has reached the users aged between 18 and 24 more than any other video sharing and telecasting network. YouTube superseded all the major video channels, including ESPN, Hulu, Facebook and Comedy Central, to cling the top spot as a content consumer among the millennial.

internet users on social networks US

With youthful adults more inclined towards watching movie and comedy related videos on YouTube, those aged over 50 preferred watching news and education related content. Hence the marketers have been actively encashing the popularity of YouTube to endorse their products and they’ve been able to persuade 64% of consumers through this video sharing platform to go for their brands.

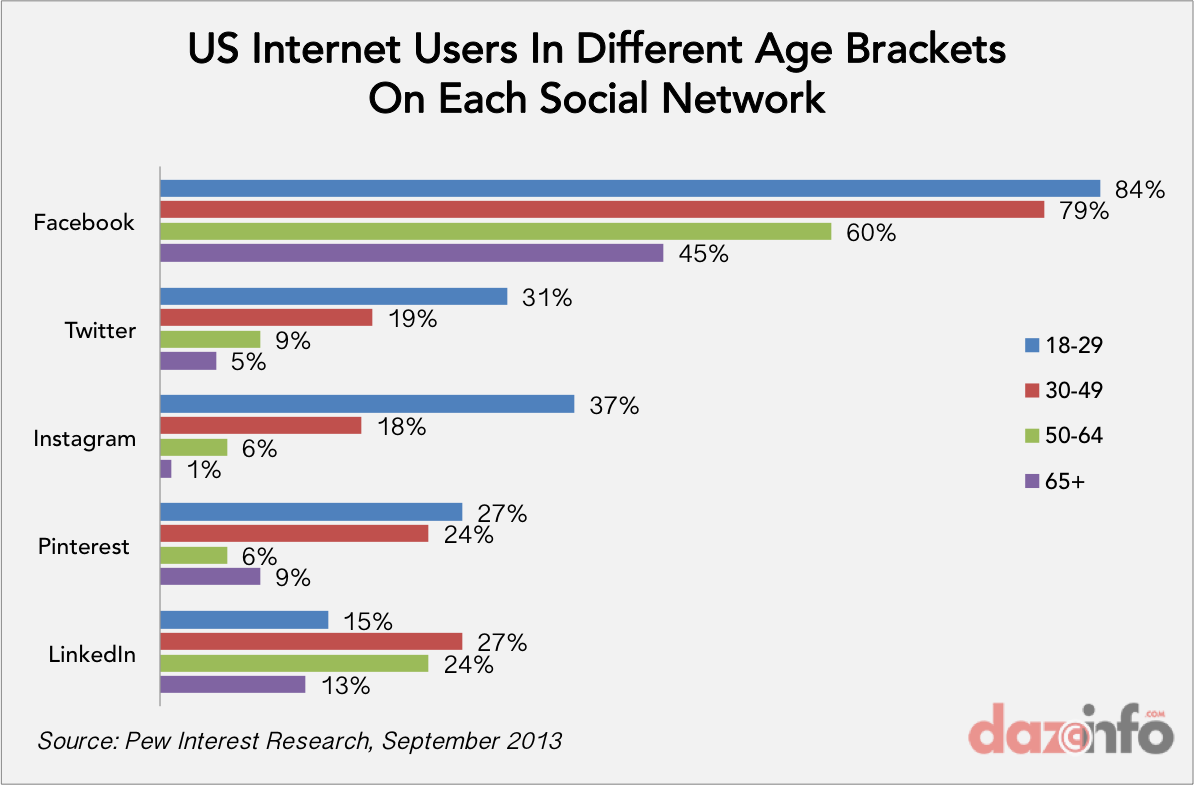
LinkedIn-The preferred social platform for the US matured class

We recently presented a report on LinkedIn Corp (NYSE:LNKD) being increasingly favored by the professionals all over the world and half of its total account holders belong to the US. Talking in terms of the age group the current data was not available; but according to the BI Intelligence Report of September 2013, LinkedIn has a much higher penetration among the 50-64 age group as compared to the teenage group of 18-29. Also, 27% of those belonging to the 30-49 age strata used and preferred LinkedIn over other social networks.

online video viewership in US 2014

The traversing of social media across all the strata of the American population has definitely proved to be a boon for the marketers and networkers, but there’s always a flip side involved to every advancement which can’t be ignored outrightly. Some of the negatives involved with the positives of the expansion of the  Internet user base have been the increasing worries of the Americans about intrusion of their social privacy, teens getting addicted to social media, unregulated content being shared on the social networks and many more to follow this list. Hence a considerate thinking is also required on these issues so that in near future we can boast of creating a satisfied and appeased Internet usage experience for folks of all ages.

Advertisement

LinkedIn Corp (LNKD) Discreetly Discontinuing The InMaps Network Visualization Tool !

0

The demand for professional related content among the companies is constantly surging up in the recent times. The most widely used platform for the same are LinkedIn Corp (NYSE:LNKD), Facebook Inc. (NASDAQ:FB) and Twitter Inc. (NYSE: TWTR) but LinkedIn with no doubt blazes a trail among all the three.  With a user base consisting of more than 313 million registered members and spread over 200 countries and territories, LinkedIn has definitely evolved as a prominent choice among the business-to-business marketers all over the globe and has provided a boost to the professional content revolution.

Lately, on 1st September, 2014 LinkedIn officially announced discontinuation of its InMaps tool that was responsible for the mapping of the looks of the account holders on this professional network. A proclamation on the InMaps homepage notified this along with a pretext stating that the tool has been retired so that the website can concentrate on devising new and innovative ways to envision the network. At present, the users can yet download and save their own desired maps for their future references.

linkedin

Some Facts and Figures about the InMaps feature

The LinkedIn InMAps service was initiated in January, 2011 and was inspired by Gephi which is an open source network analysis and visualization software package. It was basically employed for the network visualizations and provided to the professionals in a distinctive way to perceive different groups in their network, color code them and observe where they may cross over with each other as per hookups centered around current and previous jobs, education, social circles and so on. My making use of this tool, users were also able to interact by clicking on hubs to see different profiles.

InMaps was developed by Ali Imam, who was hired by LinkedIn as a principal data scientist for a short term and worked for this network for a precise three months tenure, thereafter making a transition to Cloudera  – An American-based software company that provides Apache Hadoop-based software, support and services, and training to business customers.  Although, the exact popularity of InMaps is not precisely deducible but the company has been constantly rethinking of newer ideas to understand the methodology of interaction of its users with the data contained on its network.

The following message displayed on the help centre of LinkedIn provides a better insight on the reason of discontinuation of this service to the avid fans of InMaps:-

“InMaps is being discontinued on September 1, 2014, so we can focus on developing new ways to visualize your professional network. Please check out the LinkedIn Help Center if you have any questions. And don’t forget to download your InMap by August 31!”

The other prominent changes LinkedIn has brought about

After being launched officially on 5th May, 2003 with an initial user base of 4500, LinkedIn has undergone several facelifts since then, and expanded gigantically. Some of the recent changes in this network include the commencement of the feature of “Long posts publishing” on their own platform,the option of “how you rank for profile views”  to get a detailed analytics of one’s profile views and upgradation of its search engine-Galene to become more faster.

With so many prominent changes in recent times and an enormously expanding user base LinkedIn delivered strong financial results in the second quarter of 2014. The company generated $534 million in revenues, which was 47% more than the revenue generated in the second quarter of 2013. The major revenue distribution was proportioned into three segments which included talent Solutions (60%), Premium subscriptions (20%) and Marketing Solutions (20%). In addition to this, the second quarter of 2014 accounted for 45 percent of unique visiting members to LinkedIn, which is really a promising factor in the coming times for this professional networking giant.

link

For LinkedIn the prime focus in the current scenario seems to be on developing algorithms which can directly integrate features on its own platform profile rather than accentuating on tools that take the users away from LinkedIn’s own pulpit and apps. And now with LinkedIn expanding its realms into the B2B segment with a billion dollar operation, we can soon expect launches of new analytical features which could help it to tap the market behaviors for the professionals hence becoming the unrivaled king of the content!

For them who missed it then, here is a video on the official launch of the InMaps service in 2011.

Advertisement

Apple Inc. (AAPL) Lists Out The App Rejection Reasons That Haunt The Minds Of Developers

7

Lately, with the release of Apple’s list of top 10 reasons behind the rejection of apps by it, expectations of getting your app listed in the iOS app store have thrived. In order to help these app developers, Apple Inc. (NASDAQ:AAPL) has taken this initiative to let them know beforehand about what they need to add and what to avoid in the process of developing their apps, so as to meet the eligibility criteria to be in iOS app store. There are a few reasons like incomplete information, bugs, broken links, etc., on the hit list of the top ten reasons that were found to be responsible for the rejection of apps on the iOS app store.

Common Reasons Behind Apps Rejection On Apple App Store

Incomplete information was found to be the major reason for the rejection of apps on the iOS app store. It was estimated that around 14% apps get rejected due to this “common” folly among apps.

The next on this list was, the presence of bugs due to which 8% of the apps get rejected as per the guideline 2.2 of PLA. The number is no less for the apps which get rejected due to not complying with the terms in the developer Program License Agreement (PLA); 6% of the apps get rejected due to this.

apple-app-rejections-chart

As per mentioned in guideline 10.6, apple’s emphasis on clean, refined, and user-friendly interfaces, 6% apps get rejected for having the user interface “complex” or “less than very good”. You can spend some time on Interface Guidelines page, published for developers on Apple website.

5% of the apps are rejected for having irrelevant names, descriptions or screenshot to the app content and functionality, in accordance with the guideline 3.3.

The other 5% apps are rejected because they contain the false, fraudulent and misleading representations or they use names or icons similar to other apps.

The apps that do not have the similar names in iTunes Connect and as displayed on the device, due to which they cause confusion, share 4% of the total rejections.

The guideline 3.2 depicts that 4% apps are rejected because they contain placeholder text.

Similarly, 3% apps are generally rejected due to their inappropriate ratings of apps. This is elaborated in the guideline 3.8.

Apple is always committed to provide the best user experience to all of its users. Therefore, the company doesn’t encourage developers to put the apps that are either incomplete or under test runs. Nearly 2% apps that declares itself under beta, demo, trial, or test phase are bound to face the rejection.

Why And What Is Necessary To Know About Apple App Store ?

 So, when you aspire to have your apps on the Apple App Store, knowing about Apple’s App Store guidelines related to terms, user interface, norms become an essential element of an app development. This helps developers not to face the rejection, eventually. This calls for an action to know the necessary ingredients to be made the part of research before sending the app for approval on the app store.

There might be various things that are to be taken care of; As a developer, you should be aware of the Program License Agreement (PLA), Human Interface Guidelines (HIG) and about various other licenses or contracts between you and Apple. This helps you to get your app listed on Apple App Store without any bumpy rides.

Functionality is an important aspect you can’t afford to avoid. You must be aware about several reasons for which you might be rejected as discussed before. Apps that crash, exhibit bugs, do not perform as advertised by developer or if they include undocumented or hidden features are all rejected. Metadata which includes name, description, ratings, rankings, etc., is another important thing to be kept in mind.

An app developer should also know about Content and Intellectual Property Right that includes all terms and conditions mentioned in the guidelines for using Apple’s Trademarks and Copyrights.

Moreover, there are various other genres to work upon, when you are developing an app. You have to take care of certain norms of some common issues like privacy, media content, objectionable content, violence, pornography, religion, culture, ethnicity, games, gambling and many more.

Apple and Google in play

There are many developers who prefer to turn towards Google Play Store to avoid the stiff process of approval on Apple App Store. However, they fail to gaze the ROI of efforts required to get their app on Apple App Store – which is nearly 4x higher than Google Play Store. It is important to be noticed that in spite of the largest and handsome share of app universe Google enjoys –  75% app downloads market against 18% of Apple – the company takes only $1.1 million per day in app revenues while Apple takes $5.1 million each day. This wide and incomprehensible difference might lead to various “unconventional comparisons”, taking from search to app prices for terms and conditions to genres of apps. There is this gap in everything they possess nevertheless the popularity is one thing that they can compete with.

Advertisement

Telecos Are Spending 46% Of Marketing Dollars On Digital Marketing: 84% Planning To Increase It Further !

1

Mobiles have played a significant role in the revolution of the digital marketing and one of the illustrations for the above transformation is the recent survey report by Adobe which showed that about 71 percent of tablet and mobile phone owners accessed their social media accounts from their mobile devices. Sometime back, we had presented a mix of many reports from reputed firms who analyzed digital marketing trends which can provide a clear idea of the market spending on this sector.

The mobile era has provided a better business interaction for the entrepreneurs with the consumers and telecom companies have definitely played an immense role in this. A recent report published by Econsultancy and Adobe titled “Digital Marketing in the Telecom Sector” provided an insight about the key trends, opportunities and the challenges for the teleco industry pertaining to the digital strategies. The research was based on a global survey of more than 200 telecom company executives located mainly in North America and EMEA (Europe, Middle East and Africa) region.

blue-750x373

The Big Data turning out to be really big for the telecos

The report deduced that digital marketing is a strategic preference for the telecos and the ratio of telecom marketing budgets devoted to digital as compared to companies across other sectors is 23:19. In addition to this, the report also revealed that 84% of the telecom executives projected to escalate digital marketing technology spend over the next year in contrast to 70% across all sectors. The reason for this free flow of funds to digital is not arduous to guess because Telecom companies are the ones that account for gigantic data due to people signing up contracts with them to use their network, hence they see this big data as a huge opportunity to make their organization more capable, competent and competitive. The further unlocking of the value of this big data can be done by connecting the platforms of integrated marketing. The US seemed to so far supersede EMEA in integrated marketing; 64% of US marketers acclaiming that they were able to feature the inputs of the marking industry across various channels as compared to 35% of EMEA respondents accepting the same.

Although the stats figured that the customer experience and satisfaction is the best way to take a lead in differentiating businesses from their competitors (20%) but the survey gleaned that telecom industry didn’t give this factor the same importance (15%) which was no less than a surprise.

opportunity for a company

Content and Display- hot favorite segment of investment in digital

Adding more to the lines of the preferred investments of the telecom sector, nearly 66% of the survey respondents said that they intended to hike their expenditure in content marketing. With 62% respondents, the next to follow in this investment list was the segment of online display, which can be presumed to lure in greater returns for the endorsers due to the better implication of the first and third-party data to target ads. This data analysis of the budget spendings was in alignment with the revelations of the annual Marketing Budgets Report, published by Econsultancy  in the month of February this year. The respondents also agreed that their main focus would be on the use of apps as the primary channel to engage with mobile users and this has been already visible by the increasing use of Third party mobile apps among the user base of Twitter and Facebook.

budget plan for digital marketing

Technology and Skill Gap-The major staggering factors

The worrying aspect in the expansion of the digital technology of the telecos which was outlined in the report was the lack of newer technological reforms. Two in five (44%) respondents only told that they had the ability to utilize technology to its full extent, while another 31% saw their implementation as an issue. Although the market competitors of this industry are still half way to acknowledge this apt tech-quotient hence the worry factor involved for the telecos is still very less and an increased spending in the digital markets would help to a great extent in tackling this issue yet this in no sense is a guaranteed solution.

Therefore the marketers need to have clear blueprint and a well-defined plan of action which would help the organizations to form a far-reaching progression of integrated tools and platforms.

Advertisement

Apple Inc. (AAPL) And Samsung (005930) Losing To Micromax In Tablet Market In India !

1

The tablet market in India is finally showing signs of some improvement after a series of disappointing quarters in the past. Interestingly, homegrown tablet vendors Micromax, who has eaten into the tablet market of Samsung Electronics Co. Ltd. (KRX:005930) and Apple Inc. (NASDAQ:AAPL), drive the growth in the second quarter. According to the latest data released by IDC, nearly 860,000 units of tablets were shipped in India during the second quarter of this year. Korean electronics giant Samsung led the market with 163,400 unit shipments, but the biggest surprise came in the form of Micromax who leapfrogged Apple to grab the second lead position by shipping more than 120K tablet devices. When compared to the previous quarter performance of Apple and Micromax, it looks like both the companies have swiped their position in the list. In the first quarter of the year Apple followed Samsung with 14% market share while Micromax stood at third position with just 9%, which is vice-versa in the second quarter.

tablet vendors in india market share Q2 2014

The tablet industry in India recorded a 9% quarter over quarter growth in Q2, 2014. Tablets with screen size between 7-inches and 8-inches emerged as the most favorite choice among tablet users. Nearly 88% of tablet shipped during the second quarter sported screen size of less than 8-inches.

The top five vendors of the tablet industry in India consisted a little above than half of the market during Q2 2014. Lenovo and Datawind were the other top players who, together, contributed 13% of the shipments.

However, unlike the Smartphone market, a big chunk of the tablet market was controlled by other regional and local players, which resulted in 45% of total tablet shipments during the second quarter of the year.

The performance of tablet devices during the second quarter also speaks about the growing influence of low-price and entry-level of tablet devices. While the majority of Samsung ‘s tablet sales came from sub-$200 tablet devices, iPad Mini emerged as the top-selling iPad with 60% of Apple’s total tablet sales driven by it.

Tablet shiments India 2014

It is worth noticing that, besides Apple iPad, most of the tablet shipped during the second quarter was powered by the Android OS. Nearly nine out of ten tablet devices that were shipped during the last quarter were booting Android OS, leaving almost no room for Windows OS running on Surface tablet.

Within last three months Micromax has almost doubled its tablet shipments, from 68K to 120K units. This growth has come at the cost of Samsung and Apple who shipped only 163K and 77K units – comparatively lesser than what they shipped in the first quarter. During the second quarter of 2014, Apple recorded a sharp decline of 34% in its shipment as compared to the previous quarter, while Samsung managed to control the decline only to 7%.

India is playing a key-role in the worldwide tablet market growth. In 2014, nearly 68 million devices would be shipped in the APAC – excluding Japan – region alone, making it the second largest region by the number of tablet shipments after Europe.

Advertisement

Amazon Inc. (AMZN) Has Become A Focal Centre Of Global eCommerce Growth !

1

With the increasing penetration of Internet amidst the world population, more and more marketers as well as consumers are adopting the platform of E-commerce which has simply revolutionized the retail trade on this universal pulpit. The trade analysts have forecasted the Compound Annual Growth Rate (CAGR) of the Global E-commerce platform to be 13.54 percent over the year 2013-2018 which demonstrates the expanding realms of this market segment. One of the key players which can be attributed as the prime booster of this electronic market is the tech giant Amazon Inc. (NASDAQ:AMZNwhose logo only depicts that it sells everything from A to Z.

amazon

The giant leap of Amazon

E-commerce approximately accounts for 12% of the world’s retail trade and this proportion is assumed to double up in the coming decade, but the retail mega-giant Amazon is actually thriving at a whopping pace of three times the rate of comprehensive e-commerce growth rate and hence has emerged as the skyrocket in gaining the market shares in this sector.

ecomm2

Amazon has been already the leader of the American retail business. It’s the 35th largest company in the US in terms of market capitalization and also enjoys the status of being the ninth largest retailer in the nation, which is till now the largest Internet retail revenue-generator with the total sales growth in the Financial Year of 2012-2013 reaching $43,962,000. But the future prospects of growth for Amazon behold in the markets of the developing nations of China, India and Latin America where the E-commerce revenue exceeded the mark of $185 billion in 2012, expanding at a fast rate of 44% in contrast to the 14% growth in the US during the same time span.

Initiated by Jeff Bezos in 1994 as an online bookstore, Amazon has been the quickest in advancing itself from the limitability of desktop computers to the world of mobile phones and tablets. The launch of the first Kindle, a series of e-book readers and then the Kindle Fire is revamping it to the mini tablet computer version helped the company beat their 2012 first quarter estimates first time ever and now with the commencement of Fire TV, the company is moving even deeper into the deep digital business. Amazon registered an increase of 12.2% in its worldwide media sales (including e-books, DVDs, CDs, music and more) in the fourth quarter and in the long run the company estimates approximately 90% of its media sales to be digital and this digitization has really helped Amazon to stand tall among its tech rivals.

Amazon- the emerging third-party marketplace

The Amazon’s entry into the Business-to Business sector with the cloud computing services has largely increased its affluence and in the recent times its major concentration has been in leasing out of server space at its large data centers all over the globe so that the small entrepreneurs don’t have to risk such upfront capital investment.  amazon-web-services

It has also expanded substantially its third-party marketplace wherein the vendors can set up their own virtual online stores on Amazon.com and sell their products parallel to Amazon. Indeed, the third party retailers now account for 40% to 50% of the total products that Amazon sells each year generating 10-15 percent of its total revenue. These all new developments have exponentially protracted Amazon’s economic reputation beyond its tech competitors like Apple Inc. (NASDAQ:AAPL), Google Inc. (NASDAQ:GOOGL) and  Facebook Inc. (NASDAQ:FB)

Amazon.in and its contemporary competitors

Amazon in India boasts to provide more than 10 million different products to its customers and its latest announcement of the investment of $2 billion in the Indian Marketplace has made India the fastest country in Amazon’s track to cross the billion dollars gross. The timing of this disclosure just after Flipkart’s revelation of a massive $1 billion fund raising marks the fledging rivalry between the two online mega stores  both of them competing for the larger chunk of the  Indian e-commerce market which is expected to reach $56 billion by 2023. Although Flipkart dominates the Indian e-commerce market with close to 22 million registered users, Amazon is set to give a tough competition in coming times to it. Another Indian key company  in this online retail sector is SnapDeal which has so far generated a revenue of $435.7 million.

Flipkart_Vs_Amazon_Catalogue

Amazon’s greater strength is its implicit one-to-one customer relationship, which is invaluable and brings Amazon to the focal center of the growing role of E-commerce in the world and with such manifold strengths, we can expect it to lead this online retail marketing segment surely in the coming times.

Advertisement

How To Generate A Responsive Sales Funnel Leveraging Social Media

0

With the advent of eCommerce and online shopping, the entire strategy of the sales funnel has changed. Today, checkout optimization means a lot more than simply making sure you have enough lines open and cashiers working. Every step along the sales funnel can be optimized, and this starts with a robust social media strategy. In this infographic, we’ll examine some of the best ways you can use social media to grow your sales, increase conversions, and nurture a robust community around your brand.

Unlike the old days, where the interaction with the customer started and ended inside a brick-and-mortar store, a business with a robust social media strategy is in constant dialogue with the consumer. The consumer looks to the brand for updates, news, and even relevant entertainment from time to time.

social media sales and lead generation

You can use social media to grow your relationship with the customer into a mutually beneficial and rewarding one. Social media gives you the opportunity to continue to be visible, and therefore relevant, to customers long after their initial purchase was made. Where a brick-and-mortar store would need to rely on the customer’s own memory to bring them back to the store, social media allows you to constantly refresh their image of you in their mind, reinforcing your relationship with them.

Luckily, there are numerous tools available to the resourceful social media marketer. While they each have their individual uses, the most important tools can be organized into a few key categories, such as community builders and remarketing pixels.

Community building tools are generally cross-platform social media organization tools that allow social media marketers to easily spread their efforts across the various social media outlets available to them. Many of these services also include scheduling tools, allowing you to write posts in advance.

Remarketing pixels allow you to harness casual visitors to your site for additional marketing opportunities. Once a potential customer has visited your site, the remarketing pixel allows you to virtually “follow” them through the internet, providing multiple chances for conversion. Even if they don’t convert at first and don’t intend to visit your site again, they will continue to see your product advertised across the internet.

In the age of social media, growing conversion has become a complicated and strategic process, vital to the health and success of a modern business. Our infographic sums up the most effective ways to take advantage of the exclusive access to the consumer afforded by social media. Read on to find the best ways to nurture your sales funnel, increase conversions, and develop a robust community around your brand.

A few of the major highlights and takeaways of the infographic are:

  • Online reviews and ratings are the main drivers of eCommerce sales. 77% of online shoppers consult ratings and reviews before they make the actual purchase.
  • With 2 billion+ users, Social Media has grown exponentially in the last few years. This has convinced customers to look no further than social media networks when it comes to pre-sales and post-sales supportTherefore, 80% of customers expect businesses to be active on various social media channels.
  • Digital content creation has become an integral part of a company’s marketing strategy. Brands on social media must create compelling contents and visuals that have the potential for a call to action. This helps businesses to engage prospective customers in a far better way.
  • Show respect and say thank you to all visitors landing on your site – but in a style. Convince them to surrender their contact details by offering various giveaways, free training, and consultancy or contest. Installing a Remarketing pixel on your webpage is the best strategy to meet this without any hiccups.

social media marketing branding and sales

The above article is written by Russel Cooke – a journalist and Customer Relationship Management specialist based in Louisville, KY. and Canyon Country, CA. His work often discusses social media, customer relationship management, and software development. You can follow him on Twitter @RusselCooke2.

Advertisement

Xiaomi Redmi 1S Would Flush Out The Smartphone Competition In India!

3

Xiaomi needs no introduction now; after much of hue and cry about Xiaomi’s flagship smartphone Mi3, the Chinese smartphone has set the second smartphone on the launch pad in India. The upcoming Xiaomi Redmi 1S will go on sales from September 2, 2014 in India and, once again, the company has decided to take the competitors head on. The price of Redmi 1S in India has already been declared and at Rs. 5,999 ($100) such specification makes Redmi 1S a definite steal-deal. Unlike Mi3, if Redmi 1S is able to meet the market demand in time, it could easily become one of the fastest selling smartphones in India by flushing out all the competitors.

xiaomi-redmi-1S

Before we directly jump to the justification and conclusion, first have a look at the specification of Redmi 1S available in India.

Redmi 1S Specification

Display IPS LCD capacitive touchscreen, 16M colors
720 X 1280 pixels, 4.7-inches, 321 ppi density
Corning Gorilla Glass 2
Multitouch
Processor & RAM Quad-core Qualcomm Snapdragon
MSM 8228 1.6 GHz Cortex-A7
1 GB RAM
Adreno 305 GPU
Camera 8 MP, 3264 X 2448 pixels, Autofocus, LED flash rear camera
1.6 MP front Camera 720p@30fps
1080p @30fps video
Battery 2000/2050 mAh Li-Ion
Body 137 x 69 x 9.9 mm Dimensions
58 gms weight
Storage 8 GB internal
Micro SD Slot, 64 GB expendable
Other Features Dual Sim Mini (WCDMA / GSM)
WCDMA 3G Supported
MIUI V5
Android Jelly beans V 4.3 OS

Xiaomi Redmi 1S in-class specification comparison

Considering the price tag, Xiaomi Redmi 1S belongs to the entry-level smartphone segment. However, when it comes to specification, it easily runs over all other smartphones available in the category. In fact, in many aspects, it contests the mid-level smartphones and beats its in-class competitors with distinctive margin.

First, let’s have a look on the table comparing a few of the best smartphones that falls between $100 and $160 price bracket or matches the specification.

Screen Size Processor/RAM Battery Camera Price
XiaomiRedmi 1S   4.7” HD 1.6 GHz 4x 2000 mAh 8MP / 1.6MP Rs. 5,999
Moto E                     4.3” 1.2 GHz 2x 1980 mAh 5MP / no Rs. 6,499
MicromaxCanvas 2.2              5” 1.3 GHz 4x 2000 mAh 8MP / 2MP Rs. 9,000
ASUSZenfone 5 5” HD 1.6 GHz 2x 2110 mAh 8MP / 2MP Rs. 9,999
Moto G 4.5” HD 1.2 GHx 4x 2350 mAh 5MP / 1.3MP Rs. 10,499
Nexus 4 4.7” HD 1.5 GHz 4x 2100 mAh 8MP / 2MP Rs. 23,000

From the above table it’s clearly evident that Xiaomi Redmi 1S wins with distinctive margin. Besides, the built quality of Xiaomi’s Redmi 1S is as good as ASUS Zenfone 4 and Moto E, and the MIUI 5 makes it more adorable than other smartphones coming with the standard minimal tweaks on Android OS.

Xiaomi Redmi 1S: $100 Price Strategy

Xiaomi has decided to price tag Redmi 1S with $100 (Rs. 5,999) in India, which makes the device comparatively cheaper as compared to other Asian countries where Redmi 1S is already available. Most of the market analysts consider this as a strategic move by the company to break the world’s fastest growing smartphone market. In India sub-$200 smartphone category has emerged as the main driver of smartphone industry growth. In the first half of this year, between January and June 2014, four out of five smartphones that were sold, fall below $200 price category. Along with Xiaomi’s Mi3, which is placed at $230 price point, Redmi 1S at $100 could easily become the most preferred choice for sub-$200 category smartphone users. The smartphone market in India is showing no sign to revolt in terms of price, and the growing influence of homegrown vendors, the likes of Micromax and Karbonn, is only resulting in more choices for smartphone users considering entry-level and mid-level smartphones to buy.

Redmi 1S: Best Bang On Buck

Naturally, Xiaomi Redmi 1S is the best value smartphone a user could buy without breaking his bank. The specification makes it a tough competitor to beat for many for mid-range smartphones, especially Moto G that has been rocking the India smartphone market for last six months.

While many of the smartphone vendors took Moto G very lightly when it was launched, it’s apparent that Xiaomi had a different plan. It read the India market intelligently and placed its two major smartphones Xiaomi Mi3 and Redmi 1S for the market that has got the greatest potential to grow in the future. While Xiaomi’s Mi3 is trying to eat into Samsung’s market share, Redmi 1S is focused on Micromax, Karbonn and Motorola that controlled almost one-third of smartphone shipments in India during the last quarter.

However, the question looms is that how Xiaomi is able to put such powerful components under the hood and tag it with jaw-dropping price? Firstly, Xiaomi is not any fly-by-night manufacturer. It has a reputable force that has powered Xiaomi to compete with top five global smartphone players. Xiaomi is making every possible move to cut the corners to offer its products at a very competitive price. The company is saving money by adopting strategies like no-warehouse, no-advertising, word-of-mouth promotion and focusing on services over hardware to generate profit. Xiaomi became the fourth largest smartphone manufacturer by the number of shipments in the second quarter of this year and for a four-year startup it’s undoubtedly a big achievement.

However, for the company, it’s just the beginning; Xiaomi has only explored the nations – besides home market Chine – where smartphone market is either at the nascent stage or relatively smaller. The company will have to expand its reach to North America and Europe market to get recognized as a real global player which has the capacity to challenge bigwigs likes of Samsung, Apple and LG. Xioami Mi3 and Redmi 1S could just be the beginning. The company has a fleet of products to offer that would, as usual, force competitor to bite the bullet soon.

Advertisement

Fragmentation Of Google Inc. (GOOGL) Android: A Curse And A Boon !

3
Android vs iOS Screen Size Fragmentation Open Signal 2014

Right from the start, fragmentation of Android has been the biggest challenge for Google Inc. (NASDAQ:GOOGL). As opposed to Apple Inc’s (NASDAQ:AAPL) iOS which is known as the walled garden, Google made an almost open platform so that anyone can build anything they want in the smartphone OS and app segment. But this has turned out to be a nightmare for app developers as hundreds of new Android devices get launched every year and all of them come with various permutations and combinations of screen size, screen resolution, processors, GPUs and a varied amount of inbuilt sensors. This fragmentation is not only due to the vast amount of hardware differences, but also due to different versions of software these devices use.

The chart below shows how Android compares to iOS in terms of the device screen sizes. Samsung Electronics Co. Ltd (KRX:005930) has various Android devices on the offering starting with a screen size of 2.9 inches (Samsung Galaxy Star) to 12.1 inches (Samsung Galaxy Note Pro 12.1 Tablet). Samsung is also known to use a lot of sensors in its smartphones, especially in the flagship ones like the Galaxy S5, though they have replaced the relative humidity and the environment temperature sensors which were used in the Galaxy S4. This made some apps like WeatherSignal useless which utilised those discontinued sensors to display environment related information. This is just one such example of how app developers and even users face the issue of Android’s fragmentation.

Android vs iOS Screen Size Fragmentation Open Signal 2014

Fragmentation of Android: The most fragmented software platform in the world

According to a latest report from Open Signal which consisted of data from 18,769 different Android devices, hardware fragmentation has more than quadrupled since 2012. Samsung has made 12 of the 13 most popular Android devices, capturing around 43 percent of the Android marketshare. Even though this seems extremely large, their market share has actually dropped to 47.5 percent since last year.

According to the report, LG Electronics Inc. (KRX:066570) and Sony Corp (ADR) (NYSE:SNE) rank second and third respectively with a market share of around 4.8 percent, which shows the huge difference between the three largest Android device manufacturers. In 2013, where the top 10 Android devices captured 21 percent of the market share, this number has been reduced to just 15 percent in 2014. This becomes a great challenge for third-party app developers as they can’t be sure whether their app or game will perform as expected on all of Android devices. App and game testing becomes expensive, time consuming and tedious as developers can have access to only a handful of devices to test their apps on, limiting the quality of those apps.

Operating System Version Fragmentation OpenSignal 2014

On top of that, these devices come with various versions of Android. Even though Google has made it a necessity to include the latest version of Android on all the newly released devices, we can still see some brands releasing phones with one or two version older software. Even big name brand like ASUSTEK Computer Inc. (TPE:2357) has recently released three new smartphones; the Zenfone 4, Zenfone 5 and Zenfone 6 in the Indian market with Android 4.3 Jelly Bean pre-installed on it. The above chart showcases fragmentation of Android’s software versions across the timeline of over four years. Android KitKat was released almost a year ago but still, Android v 2.3 Gingerbread has almost 20 percent market share.

Not only that, there are some brands which are releasing smartphones, tablets and other smart devices based on forked version of Android, further fragmenting the ecosystem. Amazon.com, Inc. (NASDAQ:AMZN) has come up with smartphones, tablets and even smart TV box with Kindle Fire OS – a forked version of Android. Even Nokia Corporation (ADR) (NYSE:NOK) came up with Nokia X Platform for their first Android smartphones before being sold to Microsoft. Similarly, Chinese brands like Xiaomi, OPPO, Meizu and Gionee ship their smartphones with forked Android, each one with a different fork. Unlike other smartphone brands who provide the latest version of Android to their flagship devices at least, Gionee didn’t bother to maintain the minimum market requirement. The Gionee Elife E7 is still stuck at Android 4.2 Jelly Bean even though its hardware is perfectly supportive and optimised to run the latest version of Android on it. The problem seems to be with their custom camera stack, which is creating problems with Android 4.4 KitKat.

Operating System Version Fragmentation Comparison Of Android With iOS OpenSignal 2014
As opposed to the Android ecosystem where only 20.9 percent of devices are running the latest Android 4.4 KitKat, almost 91 percent of iOS devices are running the latest iOS 8. Even Microsoft Corporation (NASDAQ:MSFThas provided the latest Windows Phone 8.1 update to all the devices which were launched with Windows Phone 8, except for the HTC 8S for some strange reason.

Should Google try to contain Android’s fragmentation?

Google is trying to contain the fragmentation issue by a number of strategies, including making a pack with top manufacturers to provide the latest software for their devices till 18 months after their release (provided that the hardware supports it), bringing a mandate to release new devices with the latest operating system and even initiatives like Android One. Along with Android L, Google has also announced Android Wear for wearable devices, Android Auto for in-car infotainment systems and Android TV for home entertainment products. Unlike the normal version of Android, Android Wear, Android Auto and Android TV have a completely closed nature and manufacturers aren’t allowed to tinker with the software.

When Microsoft laid out their new Windows Phone platform before the world, they promised that its users and developers won’t face the fragmentation issue which was prevalent in Android. But even after four years of its release, Windows Phone has failed to capture double digit smartphone market share. This is partly because the platform was too slow and closed for brands to experiment with and couldn’t reach all the price points and capabilities to have a maximum reach and exposure in the market. This explains that the issue of fragmentation isn’t as big as it is being portrayed.

Global smartphone market share by OS Q2 2014

Android’s fragmentation issue turned out to be both a curse, and a boon for the Android ecosystem. Even though the fragmentation is a headache for developers, it also provides the kind of global reach which other competing platforms like iOS and Windows Phone can’t provide, ever. This is the reason why Android has been able to capture around 85 percent market share in the second quarter of 2014, while iOS and Windows Phone have been limited to just 11.9 percent and 2.7 percent smartphone market share respectively.

Advertisement

Twitter Inc. (TWTR) Analytical Dashboard Is A Threat To Third-Party Apps

0

It gets really disheartening when we post a tweet or share a link on Twitter Inc. (NYSE:TWTRand discover that the tweet received no replies, retweets and even zero favorites. It gives a feeling that the tweet lured nothing and nobody even bothered to have a glimpse of it. But this is not always the true case because sometimes the deadest seeming tweets actually reach a large number of folks whilst gaining a substantial number of clicks. Twitter has now expanded its reach to one and all to know how their followers are engaging with their tweets in terms of acclamation and views with the refurbishing of its analytics tool.

The micro blogging site had spruced up its new analytics dashboard back in July this year, but it was limited to just the advertisers and those with verified accounts. On the day before yesterday analytics.twitter.com ended this disparity by allowing all the populace to deduce the performance of their tweets.

The most exciting quotient

Twitter recorded a growth of 6% in its user base in the second quarter, but its total hearers are two to three times more than the active user base as most of them audience it without actually logging-in. Hence, by launching of this analytics tool, now the account holders can really whet their impact on this social network.

The most stimulating part of this analytic dashboard is the Tweet Activity Section, wherein the user can see a pictorial representation of his or her tweet impressions over the past 28 days. It also includes tweet-by-tweet metrics that divulges impressions, engagement and engagement rate for each post. In addition, the tool kit gives a breakdown of a user’s followers, revealing their gender, location, shared interests and more.

twitter-analytics-alltwitter

On the other side of the fence there’s also a huge probability that people comment and favorite one’s tweet but for some reason don’t go and click the link. Although the clicks are not disclosed publicly, but for most endorsers they are the only thing which matters to them. Talking specifically about this micro-blogging platform retweets and favorites are equally important, like clicks, but the crux for promulgation is the visible engagement for the marketers.

Twitter joining the party late

The other social media competitors for Twitter like the Facebook Inc. (NASDAQ:FB) and Google + had provided this feature of revealing the engagement quotient of a post to their users’ long time back. Due to this Facebook has taken a huge lead in the context of being the most preferred social avenue for checking out a local enterprise by the virtual commuters with 62% of them relying on Facebook and a mere 11%  of them on Twitter. Also the closing gap of Google+ in the number of users along with its +1 feature is attracting many of the marketers as an alternative platform for their promulgation; hence Twitter would have to work hard to make this analytic tool as a favored choice for the users amidst these tough emulators.

Also, to use this feature of analytics, the users must have had an account for at least two weeks and it should have not been deleted, restricted or suspended. Along with this, the languages in which the tweets must be written are English, French, Spanish or Japanese.

analytics

Proving a Threat to the 3rd party Analytic tool

The embarking of this analytic feature for the entire social mob has not only proved to be a benefice to the whole, but also posed a threat to the third-party Twitter analytics tool. These effective marketing tools for business provided a metrics, which improved and tailored the Twitter campaigns of the endorsers for yielding better result, for eg. TweetReach, TwentyFeet etc. But their hardships are sure to increase with the revamping of analytics.twitter.com due to the reduced dependencies of promoters and analyzers on these add-on pulpits.

Conclusion

Twitter has been working hard for emerging as a lucrative platform for the marketers for some time now, and hence undergone several facelifts recently some of which include the introduction of nine products during the second quarter, surfacing new ad formats in August, unveiling significant timeline Tweaks and now the recent one being the revitalization of the analytics dashboard. With all these experiments and many more of them expected to knock in soon, the “SMS of Internet”  has completely justified its worth for being the most preferred platform by the elites of Fortune 500.

Advertisement

LinkedIn Is Providing A Boost To Professional Content Revolution!

0
benefits of consuming content on LinkedIn

Content is the czar for the companies. But the ways in which it is being consumed and utilized have changed drastically in recent times. More and more business firms are now entrusting to content, but at the same time, they are constrained with the amount of time they can dedicate to searching and reading all the documental data provided to them. As a consequence of which the professionals have become highly selective in spending their worthy time on particular content. And with the dawn of online social networks providing new ways to filter the enormous amount of data on the web, consumers are now passively browsing content that has been shared by their social network or directly asking for their advice.

Following this trend aptly, a shift among LinkedIn Corp (NYSE:LNKD) members is also becoming prominent and its account holders are turning to this platform for gratifying their large and growing demand for professionally-relevant content. This year in June LinkedIn published its 2014 Professional Content Consumption Report which took into consideration how 2,701 LinkedIn members in the U.S. consumed content. These content sharers primarily commuted their professional content on this social pulpit to enhance their reputations and increase enterprise promulgation.

Benefits of sharing and consuming professional content on LinkedIn

The reach of LinkedIn as a content sharing platform is significant because the trending posts can be shared innumerable times, which makes it more effective even than the biggest content providers like Forbes and Fortune. This directly enhances the visibility of professionals and their reputation.

benefits of sharing professional content on LinkedIn

Also, working on the grounds of promoting original content, LinkedIn has now launched the feature of the creation of long-form posts directly on its platform and has proposed to make this facility reach 300 million folks.

The report also revealed that out of the total polled respondents, those who actively shared and consumed content on LinkedIn, on average spent roughly one entire working day (about 8 hours) consuming professionally pertinent content to educate themselves on the latest industry analytics and trends. Conjointly, it also discovered that the ratio of the number of people consuming professional content on LinkedIn to those consuming news and entertainment data was 41:29.

LINK_Prococo_Assets

The report also outlined some benefits of consuming professional content on LinkedIn platform. Approximately 78% of LinkedIn users consumed professional content in order to stay updated with the current scenario of the industry while 73% of them did so to explore new ideas. In addition to enhancing their industrial expertise, a large chunk of the content consumers also used this platform to build up relationships with their clients and colleagues, improving their professional image and even initiating conversation, and each of these user activity bases has a proportion of 62%, 55%, and 51% respectively.

benefits of consuming professional content on LinkedIn

The driving factors for making content dynamic on LinkedIn

The report also outlined that the most favored content breeds among the professionals for reaping industry knowledge and helping them in making decisions were new research, breaking news, and case studies arranged in the descending order of their popularity which was measured by the number of clicks and shares they got. Also, the articles with career advice were more likely to receive more clicks.

A direct link between the content length and its sharing was acknowledged too in the report with the longer posts getting more shares. This is basically due to the fact that LinkedIn being a social business platform attracts a huge professional audience and if the content topics are found interesting by its users, then the long-form content on it is generally preferred by them.

LinkedIn_Publishing_4

Also, the posts which are published on weekdays got more shares (especially on Monday and Tuesday) as compared to those published over weekends which can further be attributed to its business-network class.

LinkedIn_Publishing_5

LinkedIn has certainly evolved as a prominent choice among B2B marketers as well as for decision makers all around the globe as compared to Facebook and Twitter. It is providing multi-benefits to the content revolutionaries from sharing and consuming professional content on its platform and in the coming era continuing on the same lines, we can expect it to be the primary mode for tapping market behaviors for the professionals.

Advertisement

The State Of The Mobile App Market 2014 In The US: Two-Third Of Smartphone Users Download Zero App In A Month

2

Apple Inc. (NASDAQ:AAPL) App Store and Google Inc. (NASDAQ:GOOGL) Play store each boast of at least 1.2 million apps available for download and this in turn is causing the time spent on apps to skyrocket as well. According to the latest mobile app report form Comscore for the U.S., 52% of the time spent on digital media comes from the apps. Yet, interestingly, almost two-thirds of smartphone users in the U.S. do not download apps during a typical month. A majority of app activity now takes place on the top apps such as Facebook, YouTube and messaging apps.

Mobile Apps Drive The Majority Of Media Consumption

The typical U.S. smartphone users spend 2 hours and 12 minutes a day on a smartphone. Digital media time spent in the U.S. has risen by 24%,  largely due to mobile app usage, which surged up by 52% in the past one year. Desktop computer usage managed to grow by 1% as well and now constitutes 60% of digital media activity.

Digital-time-spend-by apps-US

The average U.S. users now spend 7 out of 8 of their mobile minutes on an app. Since mobiles are used mainly for entertainment and social networking, it’s no surprise that these apps account for nearly half the time spent on mobile apps. Hence the mobile is still largely more of an entertainment platform than desktop computing.

Mobile App Downloading Not As Popular As Believed

The report also examined the average app user habits of a typical U.S smartphone user. It was observed that at least one-third of all smartphone users downloaded at least one app every month, while the average smartphone users downloads three apps in a month. However, at least two-thirds of users do not download any app at all. Only the top 7% of smartphone users are responsible for half of all download activity in a given month.

smartphone users number of apps download in US

One explanation to the finding may be that users are happy with their available apps and are not looking for new ones. People are, however, certainly addicted to their favourite apps with 42% of time spent on smartphone occurring on the individuals most used app. 57% of smartphone users use apps every single day, while with tablet users this figure is just 26%. Nearly three out of four minutes of app usage occur on the individuals top 4 apps.

iPhone  Users Have 40% More Median Income Than Android Users

Google Android is the top operating system in the U.S. with a total of 83.8 million U.S. smartphone subscribers, which is 16.4 million more than Apple’s iOS platform. The farther one also holds a market share of 51.9% versus 42.1% for iOS among smartphone OS. However, Apple is still the largest OEM vendor in the U.S. with a market share of 42.1% and a total of 67.4 million owners in the U.S. alone.

Top Line platform app usage

Some interesting traits of both Android and iPhone users were also revealed. The average iPhone user earns a median income of US$ 85,000 per year,  40% more than that of an Android user who earns US$61,000. iPhone users are also more engaged with their devices, spending nine hours more in a given month than Android users. It is also interesting to learn that the average iOS user is likely to be younger than a typical Android user in both the smartphone and tablet segments.

Digital Media Brands Dominate The App Rankings

The largest digital media brands such as Facebook Inc (NASDAQ:FB), Google, Apple, Amazon.com Inc. (NASDAQ:AMZN) and eBay Inc. (NASDAQ:EBAY) dominate the app rankings with their assortment of available apps. These brands account for 9 of the most top 10 used apps, 16 of the top 25 and 24 of the top 50 apps. The most popular app of all is Facebook which has topped in both audience size and share of time spent across all age groups. Thus its popularity and importance to the mobile media landscape will be irreplaceable for years to come.

Although app engagement is soaring above that of desktop and browser, it remains vastly untapped as an advertising medium despite the vast utility provided by all kinds of apps. The future of the mobile app economy is bright as advertisers and media professionals continue to develop the right infrastructure.

Advertisement

Social Is Superseding The Click Shots In Online Advertising And Campaigns: Media Insights Q2 2014

0

Online advertisements have become an integral part of promulgation for marketers and they are constantly working on more and more lucrative modes in this sphere to shape their brand values as well as increase their revenues. By 2016, online advertisement expenditure is expected to reach $62 billion. Lately we had presented a report based on the analysis of digital marketing trends which provides a clearer picture of the market spending in this sector.

The realms of Internet marketing have been escalating continuously and in 2011 the revenues of online advertising surpassed those of broadcast television. Maintaining this uptrend the first half of 2013 saw a huge leap with the online ad revenues crossing $20.1 billion which was almost 18% more than the earnings for the same tenure in 2012 and this upsurge still continues in 2014. According to the Media Intelligence Report (MIR) of Q2 published by Neustar Inc. (NYSE: NSR) – a trusted neutral provider of real-time information services and analytic – on 26th August 2014, this year the media advertising spending will see its largest expansion in more than a decade, with 28% of spend allocated to digital channels. This trend will directly increase the opportunities of the endorsers to reach their customers in more effective and personalized ways.

campiagns-driving-more-impresions-and-actions

The report is crunched with the performance of online advertising channels and campaign types during the second quarter and provides an insight to the marketers of the mediums which turned out to be most effective for reaching out to the consumer base and how the employment of CRM data built to reach the top companies impacted the campaigns.

The Key Findings of the report included

  • The social channels along with the exchanges performed above the indexed average for user quality with exchanges outperforming the social by 66%. Also, the social and the networks increased their presence in the upper strata whereas the exchanges made their presence more felt at the lower end of funnel.

Cost index - Social Media cheapest

  •  Social medium’s cost effectiveness persists to boost, proving 70% cheaper than the industry average and it outshined as the only channel which performed above the indexed average for reach efficiency superseding the next best channel by 286%.
  •  CRM data performed 19x-98x above the advertiser average across the Telco, Retail and Entertainment verticals.

CRM Index

The Major Trends Highlighted In Q2 2014

  •  The video and mobile are finding their reach to the normal buyers and are no longer restricted to the expertise mobile and video networks.
  • The use of digital signal Processing (DSP) is increasing substantially among the buyers on the social platform to access social impressions via exchanges as a result of which the social costs have decreased and the reach to the consumers has increased.
  • An increased number of users have started adopting private browsing sessions, deleting their cookies in Q2 because of which the marketers have to constantly provide personalized experience through personal messages.

The report also highlighted on the influence of the “clicks” on the conversion rates and deduced a significant difference between the enumeration of the viewer and the clicker class of audience. In a study of the health care industry, the report found a ratio of 1:29 between the customer sales conversion rate of clickers and viewers of ads. Analyzing this difference of the consumer rates the marketers can utilize these stats for optimizing their business revenues.

Also, the reach of videos is continuously broadening and with some exuberant events like FIFA World cup piling up in the Q2, the advertisers gigantically increased the video impressions by making best use of the networks providing soccer-related content. Although the network cost saw an eruption of 28% in the last quarter, but it involved the trade off of new and better video targeting and measurement tools giving the advertisers the power to enhance the brand efficacy and awareness. Conjointly with the expanding zones of video and mobile, attribution is another rapidly expanding domain of the current market scenario and more and more number of marketers are earnestly looking at attribution instead of last-click and last-touch.

The advertisers should constantly work on innovative methods and modes to effectively use this medium of online advertisement for reaching to newer and high-quality customers, reducing the ad expenditure which is not able to persuade the audience and creating an influential background for luring customers. The insights of the report provides a clear insight to the marketers on optimizing their business prospects and with such enormous pace of growth of the online advertising industry, in the coming times customers can expect a much better and personalized dialogues with the  brands and their marketers.

Advertisement

Launching Your Own Tech Startup? 3 Out-of-the-Ordinary Funding Sources

0

We all know the saying, “If at first you don’t succeed, try, try again.” This is especially true for persistent business minds who refuse to take no for an answer. A study by Harvard Business School found that entrepreneurs had a 60% chance of obtaining startup capital on subsequent ventures versus a 45 percent chance for first-timers. It’s better to try and fail to get a business off the ground than to continuously talk about it without taking action.

Source Of Startup Funding

Whether it’s your maiden voyage into business ownership or the sixth DBA of an existing LLC, the availability of funding will determine if you can get your endeavor off the ground. Here are three funding ideas you may not have considered:

Human Capital Financing

Former Google executive Dave Girouard met with six college students and his investment partners in July 2012 to test out a bold idea. There are always wealthy individuals in search of creative investment opportunities; meanwhile, many young entrepreneurs simply need a monetary boost to get their businesses going. Girouard brought the two groups together, incorporated human capital contracts into the business model, and his new company, Upstart, was born.

In a human capital contract, college students and young entrepreneurs surrender a certain percentage of their future earnings for a given period of years in exchange for the capital they need to get started now. Investors use several factors, such as college major and initial business plan, to assess the risk versus potential return on a particular entrepreneur. Websites like Enziand Lumni specifically cater to students and investors looking to create human capital partnerships, and Pave is a similar option to Upstart.

Student Loans

Total outstanding student loan debt in the U.S. currently sits at more than $1.2 trillion, according to the Consumer Financial Protection Bureau. Part of the reason is simple: Any student can get them. The basic requirement to qualify for Direct Unsubsidized federal loans is being enrolled at least half-time in a degree or certificate program. Dependent students (those whose parents still claim them on their taxes) can borrow up to $5,500 in their first semester, while independent students can take out $9,500. The amounts rise incrementally as you get closer to graduation.

The best part about financing a business this way is that the loan repayment periods do not start for six months after leaving school. There are also several ways, including deferments and forbearances, that allow payments to be delayed if you’re unable to meet the obligations due to financial insolvency.

Bootstrapping

Gawker, the New York-based gossip website, started out in founder Nick Denton’s living room in 2002. Today the company is worth well over $150 million. This same model can work for anyone.

Think thrifty in the beginning. Start with a cheap WordPress website instead of paying someone to build one. A brick-and-mortar business can be started in shared office space, which will save thousands in rental costs. Use free open-source software like OpenOffice as opposed to Microsoft Office.

Instead of asking family and friends for money, do a personal financial inventory. Consider selling any future annuity or structured settlement payments to J.G. Wentworth for a lump sum of cash now. Homeowners can inquire about a line-of-credit or equity loan, as home prices across the country continue their upward trend. Selling your home and downsizing to an apartment or living with family and friends is also an option.

There are more ways to finance a small business today than ever before. Persistent entrepreneurs will ultimately find theirs, no matter what.

Advertisement

Four Out Of Five Entrepreneurs In Fortune 500 Prefer Facebook Inc. (FB) And Twitter Inc. (TWTR) !

2

A couple of days back we presented a report on the increasing roots of the social business among the entrepreneurs to enhance their success levels and now the recent report published by the Fortune 500 has further entrenched this trend by revealing that the top gun companies are now increasingly embracing to the same social media platforms  – especially Facebook Inc. (NASDAQ:FB) and Twitter Inc. (NYSE:TWTR) – which was regarded as a promulgating pulpit by the budding marketers.

The Center for Marketing Research (CMR) at the University of Massachusetts Dartmouth has been releasing studies on social media adoption by the Fortune 500 companies since 2008 and this year’s study also included the fastest expanding social media pulpits – Instagram, Google+, Foursquare and Pinterest, the enterprise network platform LinkedIn and also the gauges of acclamation – Twitter followers and Facebook likes – which finally deduced that the realms of social media havetaken a driving seat among the corporate within the Fortune 500 in the past 12 months with Twitter turning out to be the most preferred platform by 83% business elites.

The steady escalation in the usage of YouTube and Pinterest coupled with Instagram depicted that visual media, graphics are  also drawing increased attention of the top noches.  The main firms which were lucrative in this year’s study were Facebook which saw a revival of 10% from 2013 grabbing a share of 80%, Twitter grasped 83%, whereas Instagram, Pinterest and YouTube revived by 12%, 27% and 20%, respectively.

social media usage by Fortune 500 corporates

The Key Findings

  • Twitter was chosen as the best platform by the endorsers to promote and expand the growth of their business. 413 companies in the List of fortune 500 possessed a Twitter account with a tweet in the past 30 days which saw an upsurge.
  • In 2014, 157 companies, almost 31%, owned corporate blogs which recorded a decline of 3% in the use of this tool as compared to the previous year.
  • Foursquare enjoyed the largest ratification levels with a proportion of 42% companies adopting it.
  • Almost two-thirds of the companies in 2013 started to prioritize mobile customers even with the provision of downloadable apps or optimizing web contents for mobile.
  • Facebook consecutively for the second year retained the spot of having the maximum number of followers on twitter, followed by Starbucks, Walt Disney CompanyWhole Foods Market, Inc., Nike, Inc., and Intel Corporation.
  • The use of LinkedIn is virtually universal among the F500 (97%).  This is clearly a platform that provides undisputed utility for them in terms of access to vendors, customers, potential employees etc.

umassd-twitter-fortune-500-companies

Twitter as the most preferred platform among corporate

Twitter has always been the favorite among the American corporate since long and Nearly 95% Of Fortune 500 Firms On Twitter follow at least 1 User Brand Humanization  which turns  to be vital for Sustaining Long-Term Association. Based on the ratings of industry, almost 100% of food product companies in the Fortune 500 hold active accounts on Twitter, commercial banks own 94% and chemical industry holding 93% of micro blogging profiles are the highest placed firms on these stats.

umassd-twitter-fortune-500-sectors

Also the ranking of companies appears to persuade the usage of Twitter by the F500 companies. 7 out of the top 10 indexed firms on this list owned a corporate twitter account. 42% of the twitter accounts belonged to the companies in the top 200 of the list while 38% belonged to the bottom category and the similar rank pattern is prevalent in blogging as well.

The comparison of Fortune 500 with Inc. 500

The first report of CMR deduced that 8% of the Fortune companies’ blogged in contrast to 19% of the Inc. 500 and this trend remained almost stagnant for the next seven years. Since then both the groups have been trying to effectively and increasingly employ this profitable tool and now in the present scenario the stats for the same stand as 52:34 for Inc. 500 blogging vs. Fortune 500 blogging.

The F500 have consistently favored Twitter over Facebook while the Inc. 500 has been following just the opposite trend. However, the band-gap between them seems to be narrowing with the passing years because as compared to the last year’s ratio of 70:77 of the number of corporate on Twitter to Facebook , this gap now has now reduced to 83:80 for the same.

The conclusions

The behemoths of business are continuously experimenting with newer social networking tools such as Pinterest, Foursquare and Instagram. With these emerging groups perfectly fulfilling their expectations, we can hope for the corporate in near future to develop more dynamic relations which would definitely strengthen their position in the industry.

Advertisement