Home Blog Page 359

Facebook Inc. (FB) Records An Impressive 170% Increase In Referral Traffic Growth To Websites! [REPORT]

0

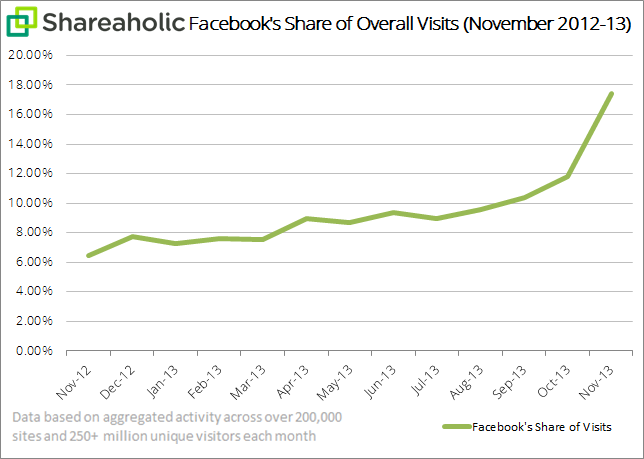
Numerous brands and other publishers are increasingly adopting social media networks like Facebook Inc. (NASDAQ:FB), Twitter Inc. (NYSE:TWTR) and LinkedIn Corp. (NYSE:LNKD) due to heavy user engagement and referral traffic through such sites. The social media titan with a massive 1.189 billion user continues to impress with the king’s share in referral traffic rate from social media sites. Earlier in September 2013, Facebook acounted for 10.37% of overall visits to websites, according to shareholic, which surveyed 200,000 publishers with more than 250 million monthly unique visitors. This figure just rose up to 11.81% in October and an impressive 17.41% in November 2013.

Facebook Inc. (FB) Referral Traffic Increased By 47% In The Last One Month!

Facebook is innovating itself vividly and this has resulted in a spike in referral rate for websites. Earlier it was well-known to drive referral rate to consumer brands and and other B2C firms, recently, it has also intervened into media pushing websites, resulting in a rise in Facebook referral traffic rate by 170% to the media publishers’ websites.

In the table below we can see a remarkable increase in referral traffic rate through Facebook to websites. Earlier in September 2013, Facebook’s share of referral traffic was 10.37% and 2 months later it rose to a whopping 67.8%. Few reasons which could be attributed to these facts are summarized below.Facebook share of overall visits in november 2013

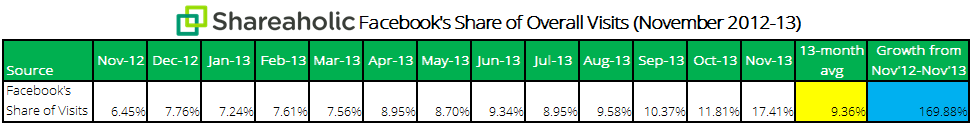
Is The NewsFeed Revamp Influencing The Referral Traffic To Websites ?

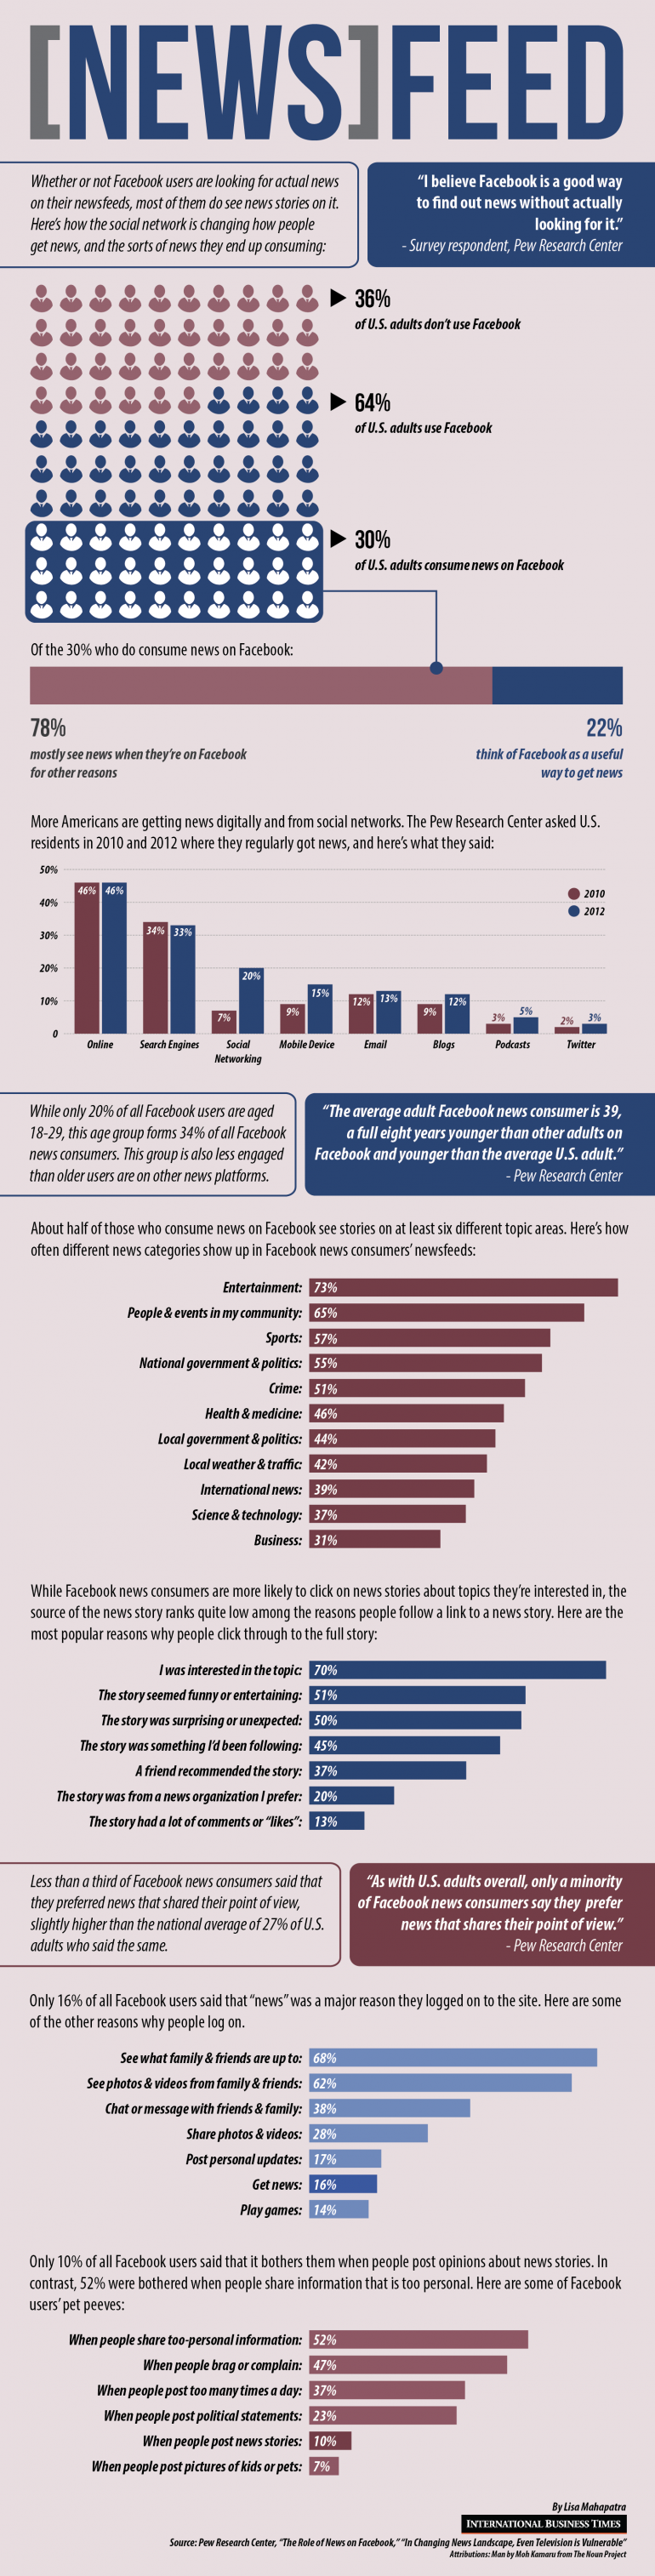
With an increasing demand for news consumption by users through various media publishing sites, Facebook recently revamped its news feed algorithm and story bumping feature. From now on, users will see only relevant news on their news feed, based on their interaction and engagement with news feed posts. People enjoy viewing quality content about their favorite brands, companies, celebrities or sports stars, hence Facebook is trying to provide news which a user may find more relevant and exciting to engage with. After users click on a particular news story, 3 more related articles will be shown directly below the NewsFeed post which might interest users.

Even the story bumping feature is updated which highlights any news when a user’s friends or close peers might have initiated a discussion or placed their opinions so that users can also participate in voicing their opinions. This has been one of the prime reasons why users are engaging more, thereby contributing to the increasing referral traffic to websites. The number of shares and likes have increased at an exploding rate in the last couple of months. The number of likes rose to 4.5 billion in the last 12 months and the number of shares marked a record 94% increment from 2.45 billion shares per day (May 2012) to 4.75 billion/day (August 2013).

Facebook share of overall visits1 in november 2013

Facebook’s Revamped Like, Share Button Influencing Referral Traffic Rate?

Facebook recently revised its like and share button to provide better visual effect of the blue palate with F Facebook logo instead of the traditional Facebook thumb. Facebook’s buttons are viewed 22+ billion times a day across 7.5 million sites across the web. People love sharing any interesting articles with their inmates on Facebook and initiate discussions and exchange views and opinions. Facebook was hoping to see an increase in usage of liking or sharing activity due to the revamped feature as they provide better visual experience to users. Also, increasing engagement rate of users is likely to lead to a rise in the referral rate of websites. Sharing posts has become an irresistible activity for most of the Facebook user-base especially teens, who share a lot of posts randomly without much knowledge.

Specific Ad Targeting Initiatives And The Highly Evolved Facebook Mobile Technology, Increasing Referral Traffic Rate!

Robust development in Facebook mobile technology is yet another reason why user engagement is increasing, resulting in a surge in referral traffic rate. More than 874 million users are now accessing Facebook on the mobile platform, which signifies how the mobile technology has evolved for Facebook. Hence, users are more comfortable engaging with various brand websites or media publishing sites on Smartphones and tablets. Facebook recently recorded an epic 253% increment in mobile referral traffic rate to websites.

Specific Ad targeting initiatives by Facebook like the custom audience feature has resulted in increasing engagement as users can see ads of brands which are more relevant to them. Hence, brand engagement rate is higher resulting in increasing referral traffic rate to brand websites. Location based ad targeting or gender based ad targeting are a few other features which have encouraged users to click on the brand ads and visit their website to shop or view products.

Advertisement

Facebook Inc. (FB) No More The Best Tech Company To Work For In 2014 !

3

Despite of heavy checks and enormous exposure across the globe, Facebook Inc. (NASDAQ:FB) failed to secure its top position in the list of ‘Top Tech Companies To Work For In 2014’. The recent Glassdoor report titled ’50 Best Places To Work For In 2014′, which is based upon the Employees’ Choice Award, ranks Twitter on top, followed by LinkedIn and pushed Facebook to the third position in the list. This could be disappointing for Facebook after topping the list for three consecutive years – 2011, 2012 and 013.

Overall technology companies have emerged as best places to work for employees. Out of the top 50 best places to work in 2014, 22 companies belong to the tech industry. What is more surprising is that tech giants such as Google and Apple failed to live up to the expectations. While Google managed to secure 6th position in the tech list, Apple was pushed further down to the 16th position.

Top Tech Companies To Work 2014

The biggest shock was that Microsoft failed to make the list while smaller companies such as eBay, Salesforce, Rackspace secured positions in the list.

The Glassdore list of iTop Tech Companies To Work In 2014′ holds more value than other similar list released by various monitoring bodies of the industry, that’s because this list is largely based upon the inputs provided by the employees who choose to participate in an anonymous online survey and provide independent feedback on their work environment, job and company culture. After recording all responses, Glassdoor implements the Proprietary Algorithm to conclude the list based upon quality, quantity and consistency of reviews.

However, the Glassdoor list is not confined to the tech industry and the list comprises overall ’50 Best Places To Work For’.  For the year 2014, Bain & Company leads the list with a rating of 4.6. Twitter and LinkedIn secured 2nd 3rd position, respectively in the overall list, while Facebook and Google claimed 5th and 8th position.

It would be interesting to see how companies in the 2014 list secure their positions next year due to the fact that some of them either just went public or are gearing up to launch their IPO anytime next year. Definitely, the post-IPO scenario attracts many changes and it could be surprising to see how these companies will cope up to upcoming reforms.

Source: Glassdoor

Advertisement

Can Google Inc. (GOOG) Ever Succeed In Making Android The Next Business Mobile Platform?

5

Earlier in October this year, SAP and Samsung announced their collaboration in promoting Android  – a flagship Smartphone OS from Google Inc. (NASDAQ:GOOG) – for small and medium-sized businesses. The companies are going to work together to develop solutions in the field of mobile security and management. Samsung is launching the KNOX project for these purposes, using which it will distribute business tools for IT organizations.

“Many of the world’s largest enterprises depend on SAP® applications for their critical business processes, and that trust now extends to enable the safe adoption of Android in the enterprise. With the increasing use of smartphones in business, Samsung KNOX addresses the mobile security needs of enterprise IT, without invading the privacy of its employees.”  – said in the SAP statement.

Android for BusinessSamsung emphasizes that they will focus on long-term cooperation with SAP to implement their own vision and distribution of the BYOD model for businesses.

The demand for such products will grow but only if they meet quality standards. Here are some facts: BlackBerry Messenger, the application for short messages exchange via a secure protocol has recently been launched on the Android platform and just inside eight hours it was downloaded by 5 million users but the problem remains that businesses that do not want to use BlackBerry solutions are choosing iPhone as their Smartphones and choose the Windows Phone 8 to a lesser extent but they very rarely opt for an Android. Experts say that Android has some issues, which make it not-suitable to the corporate environment. And if Google does not care about rectifying these, the Samsung and SAP project may face trouble when it comes to finding customers.


Security Challenges:

Android is more vulnerable to viruses than all the other platforms. Hackers and people who make malicious programs are aware that Android is the platform to target. Applications with malicious code can be found in the official Android app store, Google Play. Android’s open source nature allows hackers a little more freedom than Apple’s closed environs.

Lack of high-quality software:

Almost all innovative applications for mobile devices appear first on the iOS, followed by Android. Sometimes app developers, whose apps are highly successful on the iPhone, do not even care about developing it for Android. Thanks to the fact that the developers earn on iOS app more than on Android app. Android users are just not used to spending money on software. No demand – no offers. This is true for the consumer apps, entertainment applications, and for specialised business software.

Short Battery Life:

Buying a new Android Smartphone? You cannot say for sure how long it can run on a single battery charge. This factor depends on the software used, and on what OS version is used to a large extent. But generally, Android users have to admit, that most of the actively used devices based on this platform can not survive a day without recharging. In that context, the iPhone and BlackBerry are still a better choice than an Android powered Smartphone.

Size Issue:

Most modern and powerful Android-devices are too large for comfort. Phablets aren’t business devices even though they are picking up the market. In this case, a 4-inch iPhone looks much better but a little scale is indeed necessary to keep up with the growing demand for a larger screen Smartphone. Probably, that’s why rumours have claimed that Apple is testing variants of large iPhone that sport a 4.7 inch and 4.9 inch display.

Of course, there is always a possibility of buying  a low-priced Android Smartphone of the right size, but there is no guarantee that they will work as smoothly as a top gadget from Samsung or HTC, which are much larger than an iPhone. Therefore, the search for convenient Android devices for business purposes has always been a compromise.

Advertisement

Google Inc. (GOOG) Owned Android Hit 1 Million Mark In Malicious And High Risk Apps, Apple Takes The Honours In Mobile Phishing [REPORT]

0

With increasing usage of Google Inc. (NASDAQ:GOOG) owned Android and Apple Inc.’s (NASDAQ:AAPL) iOS powered Smartphones, the number of malware threats and high risk apps have seen a significant growth. Cyber criminals are making constant efforts to develop efficient and undetectable malware apps which can steal sensitive personal data. Earlier in Q2, the Android volume threat grew and had reached 718,000 by June 2013, according to Trend micro. Recently, the figure surpassed the 1 million mark, alarming a majority of Smartphone users to remain extra cautious and avoid hazards.

Malicious & High Risk Apps Recorded A 39.2% Increment Compared To The Last Quarter!

If we analyze the graph below, the volume of threats is continuously on the rise at an explosive rate on a monthly basis and the increment is much higher than the predicted value. Earlier in January 2013, the volume of malicious and high risk apps was around 425,000 and it almost doubled in the next 6 months (June), reaching the 718,000 mark. In the second half of 2013, the figure saw a steady increase from 718,000 in June to 820,000 in July, then 861,000 in August and finally surpassed the 1 million mark in September 2013. Compared to Q2, an increment of 39.2% was registered in the volume of risky and malicious apps.Mobile threat growth

Nearly 4 in 5, that is 80% of high risk apps performed malicious routines, while the remaining 20% had a high risk routine like that of an adware. Hackers are successfully cashing in on the vulnerabilities in the Android and iOS devices and are duping mobile device users across the globe. In Q3 alone the Smartphone shipment rose to 250 million in sales. This figure is indeed motivating for hackers worldwide. Users are often tricked in and end up disclosing personal details which are used by hackers to perform banking transactions or to trick other friends of the victimized users on various social media platforms by posting spam on the users’ behalf. Nearly 15% of social media reviews are expected to be fake.

Amongst the malware and risky apps, info-stealing FAKEINST took the top spot, accounting for 34% of malicious threats followed by malware-downloading OPFAKE (30%). OPFAKE comes bundled along with the well-known mobile browser Opera Mini. FAKEINST is yet another Android malware program which has proved dangerous for users. Both of these are known to target Android phones and steal money or bounce cash to other accounts by sending SMS messages without the user’s knowledge to a premium rate number and collect data about the victimized device. Personal data related bank accounts or social media profile login details are likely to cause nightmare for victims. In 2012, nearly $4.9 billion were stolen from the consumer banking accounts through malware attacks.

Apple Inc. (AAPL)’s iOS Was The Top Choice For Mobile Phishing, Leading To Identity Thefts!

Apple was one of the top phishing targets for cyber criminals across the globe. The volume growth in Apple related phishing sites reached 8,500, an increase of 8.9% from 7,800 in the previous quarter, and a whopping 844% increase compared to the first quarter figures of 900. There was a sudden spike in mobile phishing sites in May due to rumors about the iOS 7 release. In June and July, news about the iPhone 5c was floating in the market, providing a mouth-watering opportunity for hackers, resulting in yet another spike in growth of phishing sites.

malware threats for apple

Innovations like the Apple Touch ID finger print sensor might bring some relief to the users in their efforts to try and remember different passwords for different accounts, but it is likely to provide a gateway to hackers in innovating new and undesirable malware threats and cause serious damages for users. Touch ID was the main target in the recent past, due to its use as a key controller for multiple Apple products. Mobile phishing sites targeting users across various Apple products are asking for their government IDs. These could be used for identity thefts. The hackers have gone a step ahead from asking the usual email id, password & bank details and moved on to Government ID to successfully utilize the same for identity thefts.

Source: Trend Micro

Advertisement

Apple Inc. (AAPL) Maintains Its Lead But Samsung Narrows Its Gap : Mobile Ad Impressions, Q3, 2013 [Report]

0

Apple Inc. (NASDAQ:AAPL) maintained its top position among Smartphone manufacturers with 34.99% of ad impressions worldwide, as per a report by Millennial Media. Although its share of ad impressions fell by 4.32% as compared to Q2, 2013 . Consumer electronics giant Samsung maintained its second position with 29.58% of ad impressions. Although it reduced the gap between itself and Apple by 3.39 % as compared to Q2, 2013.

Top 20 Mobile Devices By Impressions In Q3, 2013

Even though the number of ad impression’s fell by 1.52% when compared with Q2, 2013 to a low of 20.73%, the iPhone maintained its lead position among the top 20 devices as per ad impressions. While on the other hand Samsung Galaxy S strengthened its second position by increasing the number of ad impressions by 2.4 % to 12.2 % as compared to Q2, 2012.

Three of Apple’s devices, the iPhone, the iPad & the iPad Touch made their way into the top 20, while Samsung had 6 of its devices in the top 20 devices, as per ad impressions. Blackberry which had 4 devices in Q2 had only 3 devices in Q3 among the top 20.

Just like Q2, tablets showed a 3% Y-O-Y growth to corner 23% of the ad impressions. While the share of Smartphones reduced by 2% Y-O-Y to 73%. Six of the top 20 devices in this quarter were tablets.

Smartphone vs Tabets by Impressions Q3, 2013

The Apple iPad was responsible for a majority of ad impressions in the tablet segment with 55% ad impressions. The iPad leads among the tablets.

Market Share By OS 2013

The iOS and Android continued to maintain their monopoly in ad impression’s while accounting for 93% of the market. Android saw an increase in its share from 52% in Q2, 2012 to 56% in Q3, 2013, while iOS increased its share from 34% in Q2, 2012 to 37% in Q3, 2013. Both Android and iOS grew their market from Symbian and Windows OS. While the fall of Nokia, the Symbian OS market share went down to zero, Windows OS market share fell down by 4% to 1% as compared to Q2, 2012.While Blackberry OS share of ad impressions fell by 2% compared to Q2 ,2012 to 6%.

Developers Trend Ad Impressions Q3 2013Source Millenium Media

Advertisement

India Is A Lucrative Online Display Ad Market : 96 Billion+ Ad Impressions in Q3, 2013

0

A third largest country by the number of internet users and the second largest by mobile subscribers, India is gracefully marking its presence on the global online business forum. With 164 million internet users, by September 2013 that caused 96 billion display ad impressions in Q3, 2013, India is one of the most lucrative online markets now. The trend depicts a promising growth in online advertisement, especially in Retail and Finance sectors in the future.

According to the latest Ad Matrix report from ComScore, more than 3900 advertisers ran online ad campaigns in September 2013.  On an average, this resulted in 395 ads viewed by each active internet user in India. The report exposes a few really astounding data points and statistics crucial in understanding India’s online display ad market:

Top Online Display Advertisers In India By Industry

30.2 billion online display ads were served in September alone. Retail, online media and computers remained the top category advertisers came from.

Top Online Display Advertisers in India By Industry

Top Online Display Ads Publishers By Industry

Social media, portals and services together generated about 68% of the total online display ads impressions generated in India in September 2013. Nearly 2 out of every 5 impressions were generated on social media networks alone.

Top Publishers In India by Industry

Top Online Display Ads Category In India

Retail and Finance industries have contributed the maximum in online display ad market in India in the last few months. Between June and September 2013, the Retail industry saw nearly 6% surge in number of total ad impressions by all advertisers from the industry, reaching 3.97 billion impressions in September. However, the Finance industry in India has presented a better show in the last few months as the number of ad impressions increased nearly 30% during the time reached to 1.19 billion.

Top Online Display Ads Catagory India


Top Online Display Advertisers In India

A comparatively lesser known and free-to-use business model OLX.in leapfrogged other online majors in India, including Flipkart, Amazon and Myntra, in number of Display Ad Impressions (DAI) and Display Ad Spending (DAS) by a distinct margin. In September 2013, OLX.in emerged as the top advertiser that marketed 1.38 billion impressions, followed by Amazon, Google and Jabong with 493 million, 431 million and 427 million impressions, respectively.

Top Online Display Advertisers in India

Top Online Display Ad Sizes In India

The biggest surprise came in the form of Display Ad Sizes. While a majority of ad networks and publishers have pre-defined standard ad sizes based upon the best performing metrics, non-standard size ads performed the best. In September, 47.1% ads were inline to non-standard sizes, followed by the most popular 300px X 250px with 19.4% and the leader-board with 16%. Though the study doesn’t address specific details about non-standard size ads but it’s not too difficult to assume that in-post ads, static image ads, full-page landing ads were the ones that come under this umbrella.

This also showcases that advertisers, publishers and visitors are distancing themselves from a growing culture of traffic monetization with standard ads. While visitors are reportedly trying to enjoy 100% ad-free internet, publishers and advertisers are making every possible effort to ditch such screening by adopting unconventional styles of advertising, which has apparently been showing good results.

Best Online Dispaly Ad Size India


Source: ComScore

Advertisement

Facebook Inc. (FB) Owned Instagram Adopted By 22.4% Of Fortune 500 Firms For Marketing [REPORT]

0

The world’s fastest growing photo sharing app, Instagram is increasingly being adopted by top brands and firms for marketing purposes. Facebook Inc. (NASDAQ:FB) owned Instagram is growing at a fast pace and has crossed 150 million users, and is now the hottest platform for brand advertisers to attract customers through vintage looking images of brand themes and products. Nearly 123 out of Fortune 500, which is 22.4% of top 500, have adopted the Instagram platform for promoting their brands. Advertisers of various brands are actively posting images and videos to initiate engagement through brand followers in the form of likes and comments. Brands using the social discovery platform of Instagram, must use various hashtags to make the search easy for their followers.

The Rate Of Adoption For The Instagram Platform Is Increasing At A Galloping Pace!

Trackmaven, a leading competitive analysis provider for digital marketers, tracked 2013 fortune 500 companies’ lists and analyzed their activity on the photo sharing app, Instagram, throughout September. Out of the top 500, about 123 showcased their presence on Instagram, accounting for about 19,009 pictures and 243 videos, and interactions in the form of likes and comments. If we consider brands all over the world (not only fortune 500), nearly 65% of them have taken to the Instagram platform for branding purposes.

If we consider the adoption rate for other social media networks, 387 of the Fortune 500 have Twitter accounts and 348 out of the Fortune 500 have Facebook pages, comparatively Instagram within 3 years of its inception has attracted 123 brands and is likely to surge at a faster rate in the near future.

Rate of Instagram Adoption

If we analyze the graph above, there is a continuous increase in the adoption rate of the Instagram platform. From a mere  10 or less of the Fortune 500 firms adopting the Instagram platform in December, 2010 to a whopping 123 (of Fortune 500) in 2013. In December 2010, Starbucks became the first among the Fortune 500 to adopt Instagram, in the following year, 14 more of the Fortune 500 joined Instagram. It is vital for firms to be active on the platform and post images and engage their audiences on a regular basis.

If we analyze active Instagram accounts of Fortune 500 firms, out of the 123 Fortune 500 companies that have registered Instagram accounts, 91% (112 companies) have made at least one post on Instagram and 17% (85 companies) have posted at least one picture or video to Instagram in the last one month (September).

instagram adoption Rate

Merely showcasing presence on Instagram is not sufficient, brands must actively post images and videos on a regular basis and try engaging their fan base. Images convey messages in a much better manner compared to text. Short video ads which are entertaining and smartly embedded within brand theme or messages must be uploaded on a periodic basis.

Out of the Fortune 500 companies, 22.4% have active accounts, amongst the first 100 Fortune 500 firms, 25% have active Instagram accounts. The henceforth rankings from 101-200 reveal that 15% are active whereas between 201-200, 23% are active. It is vital for firms to update regularly and measure engagement levels for images and videos amongst the fan base.

Depiction of any particular brand message/theme via text messages or words might misguide users at times if the message is unclear or it might make them think too much in trying to understand it, which often leads to offsetting the mood of brand followers, whereas images provide a better picture and the perfect ‘feel’ to users as it’s more appealing and attractive. Advertisers must effectively use Instagram tools and its filters to provide the best possible look for images and promote brands through creative representation of images with a convincing story appeal.

Although, video content is generally more effective, a majority of respondents in the survey opined that images promote a better engagement rate than videos. Images were considered about 13-16% more effective than videos. One prime reason for this could be that – images convey messages instantly, whereas users might have to wait until an Instagram video is loaded. On the mobile platform, video buffering might consume marginally more data when compared to images, hence users find images more engaging. Brands must focus equally on videos and images, the rate of adoption for images must be higher than videos.

Instagram picture vs videos

Brand advertisers must also make sure that they avoid spamming pics or videos which might hinder the user experience. Proper analysis must be done of engagement by audience, on different days of the week and frequency of updating the Instagram feed must be influenced by the result of the analysis. In the last one month (September 2013), 1,792 photos and a mere 74 videos were posted by Fortune 500 Instagram accounts. In the graph, effectiveness is equal to total likes and comments. The average engagement rate for images was 37 interactions per 1,000 followers whereas the videos had just 24 interactions per 1,000 followers. Brand advertisers must effectively use the platform to connect to the users’ personal lives and provide them a nostalgic feel when they view the image, along with the conveyed brand message.

Advertisement

Nearly $4.9 Billion Were Stolen From Consumer Banking A/Cs Through Malware Attacks! : Thumb Rule For Social Media – Think Before You Share! [STUDY]

0

Social media networks like Facebook Inc. (NASDAQ:FB), Twitter Inc. (NYSE:TWTR) and LinkedIn Corp. (NYSE:LNKD) have provided immense opportunity for web users to express themselves, share their stories , opinions, discuss topics that interest them with their friends and families. The amount of engagement has increased significantly over the last few years. Teens largely engage with close peers on Facebook and other social media networks and talk about their common areas of interest. It is vital for social media network users to think wisely before sharing any posts as some of the posts which users share without knowledge can bring about hazardous effects. It might hurt sentiments of a few of them or might victimize the other users’ friends who engage with the shared post.

Engagement In Social Networks is Increasing At An Explosive Rate!

People these days are using the web for browsing information related to daily news, trends, sports, favorite brands, entertainment and other general news. Social media networks like Facebook are transforming themselves into an information network due to an increasing demand for news and latest articles.  More than 30% of the U.S adults consume news on Facebook. Micro-blogging site Twitter which was born as an information network serves as a platform for breaking news and updates, and spreads the same at wild-fire pace. Till date more than 300 billion tweets have been tweeted with an average of 5700 tweets per second.

If we consider engagement on Facebook, the number of likes has gone up from 2.7 billion likes per day in May 2012 to 4.5 billion in May 2013, an increase of 67%. Number of shares on Facebook was about 2.45 billion as per August 2012, and it increased to 4.75 billion in May 2013, an increment of a whopping 94%. People love engaging with interesting news articles or posts related to their topics of interest, they prefer sharing them with their friends, initiate a discussion and exchange views and opinions. On Pinterest, 80% of the content posted is shared content.

Think Before You Share! Facebook Is A Major Center Of Attraction For Spammers!

Social media networks, especially Facebook have been major centers of attraction for spammers. Social media spam has increased by 355% in the 1st half of 2013. About 600,000 Facebook logins are compromised per day, due to an increasing attack from spammers to  capture users’ personal data. Majority of these spams are propagated through shared content by a chain of users. Spammers are successfully able to dupe users by attractive posts and can often persuade them to share. Ratio of spam on Facebook and YouTube compared to other social media sites is 100:1.

PythonPost 1PythonPost 2

The picture above is the best example on how spammers tend to make users share the post and collect user data. The attractive news or video links are posted and users are asked to share the post first, in order to view the video, and once it is shared the video is never played, meaning the content is successfully spammed to other friends of the users. By this spammers have gained access and can send malware links to users’ friends and also like or share pages on the users’ behalf.

Sharing of information or knowledge is good, but if one is not sure exactly what is being shared than it might hurt other users or even put other viewers of post into trouble. Users must check their privacy settings for every post and decide their target audiences clearly. Friends must be encircled into various groups like relatives, family, college mates, and school friends and for each post, the audience selector tool must be used to select the desired audience. Passwords are not something to be shared with anyone irrespective of your relation with the person. More than 2 million Facebook and Google accounts have been compromised, of which Facebook accounts for 57%,  according to Fox news.

Users must check with their close peers before sharing any of their images or tagging them. Friends often share photos, videos and other personal details, they could be fine with it being circulated amongst the friend’s group, but might not be very comfortable with public sharing of the same on Facebook. Hence it is important for users to seek prior permission before sharing any images or photos publicly on Facebook.

Spammers love spreading false rumours as a plenty of users are likely to go about looking for information on the same subject. It allows spammers to persuades users to share their personal data and gain access to the desired rumored news. This data can be used to access bank A/Cs and other details. In 2012, $4.9 billion was stolen from consumer banking accounts through malware takeovers, according to a 2013 report by Javelin Strategy & Research. Users who have unknowingly shared some spam posts must make sure that they inform their friends and close peers not to share or pass it on to others. If a Facebook user is not comfortable confronting someone, there is a Social reporting tool with messages which users can use to inform their friends about the ill effects of their photo being shared.personal data access

Source : Facebook

Advertisement

Tablet Market In India 2013: iPad Swiped Out, 87% Users Prefer Android Tablets [STUDY]

0

I was always told – timing is everything to ensure optimum results. Just when Apple Inc. (NASDAQ:AAPL) is bracing up to face Android in India, this report diffuses Apple’s excitement with regards to the tablet market in India 2013. Barely two days ago Apple started selling the new iPad Air in India and today a report from Cyber Media Research (CMR) claims only 10% tablet users in India prefer the iPad against 87% of those who prefer Android powered tablets. The study also showcases that people in India have a higher brand recall of Samsung when it comes to the tablet space than any other device maker such as Lenovo or even the homegrown Micromax, thanks to the aggressive marketing strategy.

Tablet Market In India 2013: Android Tablets vs iPad

Indian consumers increasingly prefer tablets and the country’s younger demographics have added to the adoption of mobile Internet access devices. With changing consumer lifestyles, the Indian market presents a favorable opportunity for vendors.” said Satya Sundar Mohanty, Senior Manager, Demand-side Research, CMR.

Tablet market in India 2013 - Users Trend 2013

The study on Tablet market in India 2013 also tracked down the usage behaviour and usage preferences of tablet users.

  • Social media usage and entertainment on the go have emerged as major triggers to purchase tablets among users. Three out of four table users in India claim portability and mobility as the biggest factors behind ownership.
  • Nearly 51% of tablet users claimed they spend more than 2 hours with the device every day. And with a growing penetration of mobile internet, especially 3G, the usage is expected to rise further in future.
  • Tablets have become a major form factor in users’ communication preferences. Nearly 40% of tablet users in india claimed that they reach out to their device several times in a day to email, chat or message.
  • Generally addressed as a conservative market for paid apps, India is showing a radical shift in app adoption. 18% of tablet users have claimed they paid for some apps that they use. This could be treated as positive sign for India’s developer community who could focus on paid apps solving more ground level country specific challenges.

The CMR report is based upon the study conducted across 20 cities in India between September and November 2013. With a sample size of 3,600 respondents, the survey covered 2,400 tablet users and 1,200 non-tablet users to understand the current and future trends of the tablet industry in India.

Source: CMR

Advertisement

Apple iPad Air vs Apple iPads 2013: Farther More Popular With 3.5% Market Share [STUDY]

0

The new iPad Air, launched by Apple Inc. (NASDAQ:AAPL), about a month back, is sweeping the market with distinction. A recent study on iPad Air market share by December 2013 from Fiksu – a company that keeps a track of the overall active iOS devices worldwide – shows that adoption of the iPad Air is much faster than any of its predecessors. The iPad Air now controls 3.5% of the total iPad market in just 37 days since launch while, after the same number of days, the iPad 4 had managed to control only 1.76% of the total iPad market.  The results could have a significant impact on holiday season sales, but such a huge gap clearly depicts how the market is responding to Apple’s latest offering in the tablet arena.

This gap is apparently widening as Apple has just introduced the iPad Air in India. To lure Indian consumers, Apple has priced it at an affordable price but still the eventual price tag could prove a little heavy on the buyers’ pocket. While the 16 GB WiFi variants of the iPad Air has been price tagged with Rs. 35,900/-, its cellular version, a 16 GB variant asks buyers to shell out Rs. 44,900/-

Apple iPad Air Market Share December 2013

Overall, Apple iPad 2 is by far the most popular generation of iPads as on December 8, 2013. The new iPad Air could be gaining ground pretty fast but more than 36% of iPad users are still using the iPad 2, against 17.2% iPad 3 users and 21.6% of those using the iPad 4. Interestingly, Apple iPad Mini is also enjoying a sizable market share (20.3%).

However, since October 31, 2013 – a week before the iPad Air was launched – it were the iPad 2 owners who had migrated to the new iPad Air most. Between October 31 and December 8, the iPad 2 lost nearly 3.3% of its market. While the iPad 3 and the iPad 4 lost close to 1% share, the iPad Mini saw a slight increase in market share for the same period.

Unfortunately, despite such a terrific response to its latest debutant, Apple iPad’s market share is estimated to shrink to 30% of the global tablet market by 2017, with Android taking a big lead by grabbing almost 58.8% market share. It would be interesting to see whether the global reach of the new iPad Air can tilt the estimation in Apple’s favor or whether Apple disappoints further.

Source: Fiksu

Advertisement

B2B Marketing : Inbound Marketing Costs 62% Less Per Lead Than Outbound Marketing [INFOGRAPHIC]

1

Social Media and latest technology powered inbound marketing techniques have revolutionized the way business of sales in the B2B industry takes place. B2B marketers are largely using Facebook Inc. (NASDAQ:FB), LinkedIn Corp (NYSE:LNKD) and Twitter Inc. (NYSE:TWTR) to generate leads. LinkedIn is most vital as a majority of the crowd engages on the platform for serious business purposes.

Outbound marketing, also known as interrupted marketing was largely used when internet technology was in the course of development, and connecting with business firms was a slightly tedious task. Outbound marketing basically involves contacting someone through referrals, emails, direct mailings or cold calling. Although, outbound marketing techniques were successful in the days gone by, the rejection rates for emails and cold calls were also high.

Inbound marketing also known as permission or friction-less marketing is growing by leaps and bounds every year, as the customers themselves approach the business owners, looking for an association or business. B2B marketing firms must try attracting customers via content marketing and other similar inbound staples and build an image so as to attract customers and generate sales. Since the customers themselves approach in this case, B2B marketers have permission to keep themselves connected with the clients until the deal is closed.

Leading social media and digital marketing agency providing online marketing solutions Maximizesocialmedia, enumerated the evolution around the B2B sales strategy in an Infographic below. Few interesting findings are listed below.

  • Nearly 54% of B2B buyers begin the buying process with an informal research around business challenges and 78% of the time they use internet to initiate research.

According to Lori wizdo, Principal analyst for Forrester – ”today’s buyers might be anywhere from two-thirds to 90% of the way through their journey before they reach to a vendor.”

  • Blogging, Social media , SEO, high value educational content and permission based emails are major tools opted by inbound marketers. Print, direct mail, cold calling, trade shows, RFPs and emails to purchase list are opted by outbound marketers.
  • Inbound marketing costs 62% less per lead than traditional outbound marketing. ROI derived from inbound marketing is higher than outbound marketing.
  • Inbound marketing is much more effective than traditional outbound marketing, as in the case of inbound marketing the customers themselves approach a B2B firm for association or purchases.
  • Nearly 57% of companies reported customer acquisition through company weblogs. About 57% of them claimed LinkedIn was their source of customer acquisition, next in line was Facebook with 48% and Twitter with 42%.

B2B marketing

Advertisement

Only 16% Of Facebook Inc. (FB) Users Visit The Website Specifically To Consume News! [INFOGRAPHIC]

0
Facebook Inc. (NASDAQ:FB) is transforming itself into an information network, as demand for latest news, informative articles and details related to prevailing trends is increasing day-by-day. Media publishers’ websites saw an increase in Facebook referral traffic by 170% in the last 1 year. Between September 2012 and September 2013, TIME’s Facebook referral traffic has increased by 208%, BuzzFeed is up by 855% and Bleacher Report has increased by a whopping 1081%.
Facebook recently revamped its news feed algorithm to provide more relevant information and enrich the user’s browsing experience and it updated its Story Bumping feature to highlight stories with new comments. Although, Facebook referral traffic to media publishing websites has increased and the demand for news by web users has also gone up, but it is important to know how many Facebook users use the website specifically for news consumption, or whether they engage with news due to overflowing updates from media publishers.
A new study by Pew research center in collaboration with Knight foundation, which surveyed 5,173 adults, reported a few interesting findings and stats about news consumption habits of Facebook users. Few important ones are highlighted below.
  • Nearly 30% of the U.S adults consume news on Facebook, out of which 78% of them see news when they visit the site for some other purpose. Hardly 22% consider Facebook as a useful way to consume news.
  • Only 16% of all Facebook users said that news was a major reason they logged on to the site. More than 60% of users visit Facebook to update themselves about their family and friends’ activities and view their photos and videos.
  • Hardly 10% of Facebook users complained that it bothered them when their friends posted opinions about their news stories. Whereas 52% were bothered when people share information that is too personal.
  • If we consider news consumption source in the last 2 years, social media networks recorded highest up surge from 7% in 2010 to 20% in 2013.
  • Facebook users aged between 18-29 account for 20% of total users, but they form 34% of all Facebook news consumption.
  • About 50% of those who consume news on Facebook see stories on at least six different topics. Entertainment being the highest with a 73% coverage. Business news which accounted for 31% was the least consumed.
  • Nearly 70% of Facebook news consumers claimed that they were interested in a topic so they followed the story, about 51% felt the story was funny or entertaining, about 37% considered a friend’s recommendation and 13% were influenced by the number of likes and comments for the news article.
news consumotion habits
Source : Ibtimes
Advertisement

Facebook No More A Free Marketing Platform For Brands: Will Paid Ads Fail Due To The Latest News Feed Revamp? [REPORT]

0

Facebook Inc. (NASDAQ:FB), the king of social media advertisements is planning to devise an all-monetizing Facebook platform. Although, the social media titan drives a major share of advertising (social media industry), it seems to still be unsatisfied or perhaps it fears a drop in revenue growth in upcoming quarters. Facebook in its blog reported that the news feed revamp which will provide users with more relevant news based on their engagement on a daily basis is likely to hinder organic reach of brand related content on the user’s feed. As demand for new articles, latest happenings from media publishers, is increasing, Facebook is focusing on updating the user with the news which they love to read and enrich their browsing experience. This is indirectly going to affect the ranking of unpaid brand related content or posts, forcing the advertisers to boost the reach through paid mode.facebook-money

Will NewsFeed Revamp Affect Paid Ads?

According to Wallstreetpr, Facebook is expected to grab over 90% share of holiday shopping ad spent worth $9.4 billion. This indicates that advertisers are increasingly spending on Facebook ads with the intention of acquiring the desired engagement rate, they expect their posts to be promoted to top ranks in the user’s news feed, irrespective of whether the user likes them or not. The latest news feed revamp is likely to create a fear amongst advertisers with regards to the ranking of their posts due to the heavy competition between various news feed stories which creep to the top of the user’s feed.

Facebook’s user engagement rate has increased by leaps and bounds in the last few years. More than 73.5% or 874 million of its total 1.189 billion users are comfortably browsing diversified news on the mobile platform. If we analyze the number of likes, the recorded figure was approximately 4.5 billion per day (as in May, 2013) which is 67% more than the 2.7 billion likes/day as per August, 2012. Content shares too increased by a whopping 94% in the last one year, and the overall figure, as per May, 2013 was 4.75 billion, which is way ahead of the 2.45 billion recorded on August, 2012. The above figures have indeed excited brand advertisers to invest more, provided they get the desired results.

Facebook might have to reconsider its news feed revamp or inculcate a perfect balance between the user’s choice of news feed and appearance of promoted posts for Facebook brands. Although, media published sites are likely to increase their website traffic (via news feed revamp) and might even pay for getting their news articles promoted to the top of user’s feed, but the advertising revenue from other consumer goods firms (non-media publishing firms) is likely to get affected. Media publishers’ websites have witnessed an increase in Facebook referral traffic rate by a whopping 170% in last 1 year.

Facebook Brand Followers/Engagement Bartered For Monetary Units! Facebook No More A Free Advertising Platform!

Facebook has indirectly hinted that all those brands who are (who don’t buy Facebook ads) grabbing the user’s attention and engagement via interesting content for which they can’t use the Facebook platform for free. They have to consider investing certain amount of funds to promote their posts. Although there wasn’t any direct statement denoting the same, but tough competition prevailing between user’s choice of news feed and promoted brand posts gives brand advertisers’ post very little chance (those who use the platform for free marketing) to reach a user’s feed. More than 15 million businesses use the Facebook platform and if all of them subscribe to one or the other paid ads, its revenue is likely to boom higher than ever in a short span of time.

Facebook in its Blog, reported – As the dynamic nature of News Feed continues to follow people’s patterns of sharing, Page owners should continue using the most effective strategy to reach the right people: a combination of engaging Page posts and advertising to promote your message more broadly. Advertising lets Pages reach the fans they already have and find new customers as well. The fans you have matter. In addition to being some of the most loyal customers, fans also make the advertising on Facebook even more effective.

Facebook has hardly placed a foot wrong in innovating features which are non-monetizable. Facebook earlier in February had raised the bar by providing a PMD program badge to advertisers. The advertisers who were interested to be a part of the PMD program should buy ads on Facebook in order to qualify for the PMD badge. Those who do not wish to do so must demonstrate that they have “a Facebook holistic strategy which influences their clients on media spend”. This move was initiated claiming that they are emphasizing on necessary standards or quality of advertisers, but the main motto behind the move was driving more ad sales as advertisers would be eager to earn PMD badge for better recognition in the market. Hence they will definitely showcase themselves through paid ads.

Advertisers across the globe have expressed their frustration with the latest blog update indicating possible tough competition between user’s choice of feed and brand related posts (promoted or unpaid).

frustrated advertisers

Advertisement

Samsung To Launch The SM-W750V Windows Phone With A 5-inch Display At $750 ?

0

Samsung Electronics Co., Ltd. (KRX:005935) has, apparently, not given up on the Windows Phone because the company is reportedly testing a new 5-inch-display Smartphone powered by Windows Phone OS to launch in India. According to a recent import data leak, Samsung has shipped 25 SM-W750V Smartphones to India for R&D (Research & Development) purposes in late November. The Korean electronics giant has quoted INR. 31,967 (nearly US$513) as per unit price for the handheld, which has been obtained by Zauba – a website that mysteriously tracks down all devices imported and exported out of India.

Samsung SM-W750V Windows Phone India

Even though there is not much device information mentioned, but a quick look-up on the internet for the device code SM-W750V has helped us to reach heandsetdetection.com. A quick search on the site threw a one liner, but a fairly important, piece of information :

Samsung Windows Phone

The image clearly speaks about compatibility, OS and processor type which the Samsung Windows Phone could be loaded with.

So, how did we zero in on $750 as the retail price for SM-W750V ? Let’s roll back a few months when Samsung shipped Galaxy Note 3 (GT-N900) to India for R&D. The leaked handheld of that time quoted a unit price for GT-N900 as Rs. 31,967 (US$513) – exactly the same price that has been quoted against SM-W750V. Later, the company added another $300 dollars on the quoted price, which resulted in a launch price of $830, later discounted to $775 (Rs. 46,750).

Samsung Exploring A Possible Alternative To Android ?

It’s important to have a brief understanding about why Samsung is exploring alternatives for Android in spite of leading the market with distinction on the same platform. As rumours often claim Samsung has been accused of hijacking Android from Google, thanks to an aggressive marketing that has helped Samsung to capture 63% of Android devices market globally. HTC presents the closest competition to Samsung with mere 6.5% share of Android devices in the market.

Google is closely monitoring this space. At the MWC 2013, this was an open debate among all Googlers about what measures should be taken against Samsung to crush its exaggerated growth with the Android OS. Google’s acquisition of Motorola Mobility has been seen as a step towards setting up a strong competition in the Android market to kill Samsung’s unimpeded dominance.

Is Samsung Seeing India As A Potential Windows Phone Market ?

India and China are among the top three largest mobile countries by number of subscribers. The contribution of Smartphones in 2013 is relatively low in India though, the country is estimated to become the second largest by contributing 10.3% to global Smartphone handsets market by 2017.

Samsung is the largest mobile handset vendor in India and controlled 32.9% of total Smartphone sales in Q3, 2013. The growing competition from homegrown vendors, such as Micromax and Karbonn, are keeping the Korean mobile phone giant on its toes. Top three local Smartphone vendors Micromax, Karbonn and Lava together controlled 33% of total Smartphone sales in Q3, 2013 by riding upon the Android OS. However, Nokia – the lone survivor on Windows Phone – is not able to improve Microsoft’s share in the Indian Smartphone market.

Apparently, Samsung sees the current demography of Smartphone OSes in India as an opportunity. To improve its overall market share the company is getting all its eggs out of the single basket and is mixing them with the Windows Phone OS – a place where local Smartphone vendors are still not comfortable enough with the proposition of integration.

Advertisement