Home Blog Page 372

Apple Inc (AAPL) iOS: The Friendliest Smartphone OS [REPORT]

3

Competition among mobile phone makers before the onset of smartphones were all about features. Today, smartphones have become a software game. Every smartphone platform out there wants to win the hearts of consumers by providing a well-designed, fast, pleasant-to-use bit of software: fluid operation, responsive interaction, and fast graphics, so as to deliver the best user experience possible. And quite frankly, user experience matters a lot to end-users. No matter how sophisticated the coding underneath is, if the average non-technical user isn’t able to get what he/she wants from his/her smartphone, the user is likely to move away from the platform. The operating system, which is the heart of any smartphone, plays a very important role. The way an operating system behaves depends on its underlying algorithms. The UI is what a user sees and interacts with, so designing a friendly UI can go a long way along with integration of applications and the overall coherence.

Today we have four major mobile operating systems, namely Apple Inc’s (NASDAQ: AAPL) iOS, Google Inc’s (NASDAQ:GOOG) Android, Microsoft Corporation’s (NASDAQ:MSFT) Windows Phone 8 and BlackBerry Ltd.’s (NASDAQ:BBRY) BlackBerry OS 10. Let us take a look at the overall user experience that all these platforms deliver and find out which of these makes the user more happy using his/her smartphone, because a good experience is like leaving a good impression, and we all know how that can drive sales!

Pfeiffer Consulting has recently conducted an in-depth research to compare the five major mobile operating systems in use today: iOS7, iOS6, Android, WP8 and BlackBerry 10 and rate them in terms of user experience. The six parameters used to conduct the research were: cognitive load, efficiency and integration, customization and user experience friction(UXF).

Here are the findings:

Cognitive Load:

It is the sum of all the elements one needs to be familiar with in order to be able to use a device spontaneously and intuitively. It is one of the key aspects of user experience for any non-technical user. For this benchmark, the number of apps/widgets as well as other icons and user interface elements that a default installation of the operating system contains were counted.

iOS from Apple Inc (AAPL)
iOS from Apple Inc (AAPL) wins in Cognitive Load, while Android emerges as the worst performer.

iOS6 ranked first having the least cognitive load with a score of 32. WP8 was the only mobile OS that has a cognitive load as low as iOS7(40), BlackBerry OS 10 ranked fourth in the comparison with a score of 53. Samsung’s version of Android ranked last with the highest cognitive load of all mobile Oss (162) – with 104 apps and widgets and higher number of icons and user interface elements.

Efficiency and Integration:

Access to key settings, integration with notifications, multitasking, and camera access, among others were analyzed for this comparison.

Efficiency and Integration

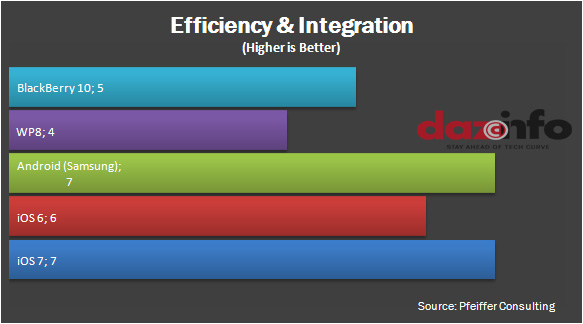
iOS7 scored 7 out of 10 and stood at top, followed closely by Android which also scored a 10, but slipped to second place due to lack of direct camera access from the lock screen.  iOS6 came second due to its good basic efficiency and integration features but lacked shortcuts for key settings.

Customization:

Android, as expected, scored the highest as it has the longest list of customization options. iOS 7 scored a decent 6 out of 10 score. It offers similar customization options as the previous release but adds dynamic type support, as well as comprehensive accessibility options.

Customization

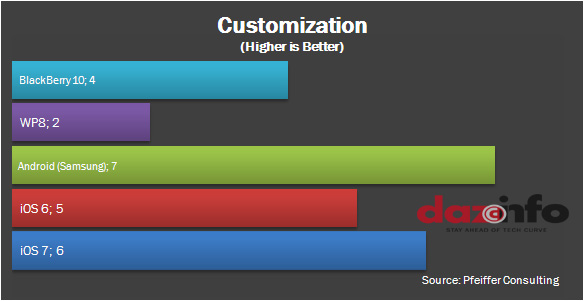
iOS 6 scored a 5, it has good basic customization options and some accessibility features that aren’t yet available in competing mobile operating systems. BlackBerry OS 10 offers basic customizations that is better than WP8 but clearly lags behind Android and iOS. WP8 finished last in this race with a score of 2/10: it offers the poorest customization options of all the operating systems taken for comparison – lack of background colours, no background image can be set for the home screen, apps can’t be grouped into folders.

User Experience Friction (UXF):

These are those aspects of a device that can annoy users due to lack of a key feature that should be available or whenever a device fails to do what users expect it to do.

UXF

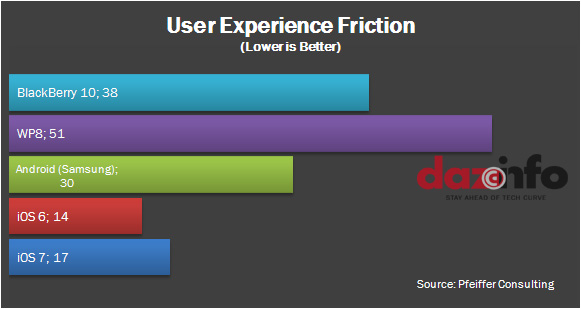
WP8 ranked high in UXF factor due to minimal customization of the user environment, which makes it oppressive after a while. BlackBerry 10’s UXF factor scored 38; absence of a Home or Back button hindered users’ experience more often. Although Android has improved immensely since earlier releases, but some aspects like the unintuitive way of deleting selected apps, or the inconsistent approach to interface design hold it back. iOS 7’s Control Center is clearly useful, yet has the annoying habit of accidentally popping up. iOS 6 had the least UXF, clearly linked to low cognitive load and a streamlined UI design. One of the elements that contributed to UXF in iOS 6 is the confusing multitasking manager that makes it difficult to kill running apps.

Clear Advantage

Overall User Experience

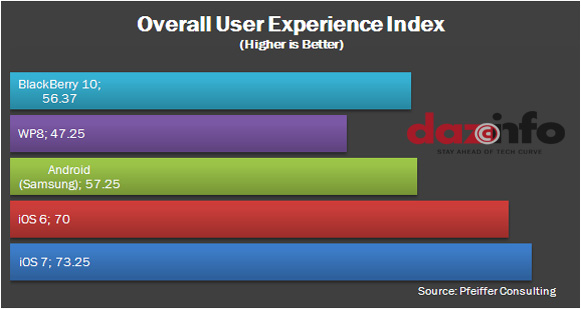
The overall user experience index derived from the combined results of the four different benchmarks gives iOS 7 a clear advantage, taking into account the context defined for these benchmarks, i.e. the day-to-day user experience of an average, non-technical user.

Source: Pfeiffer Report

Advertisement

Top 10 Best Gaming Laptops Of 2013: Alienware And Ideapad Y510 Rule

1

Are you ready for the game? Or, to be precise, are you ready to play your favourite games on the hottest and best gaming laptops of 2013? Here is a roundup of the 10 best gaming laptops of 2013. We think these 10 gaming laptops will give the ultimate gaming experience to any die-hard gamer.

Origin EON17-SLX

This is a high-end gaming laptop that is a bit expensive, though. But the high price tag is completely justified; as this gaming laptop comes with supremely powerful processor – Intel Core i7-3940XM quad-core. And even better, this laptop doesn’t offer one but two discrete graphics cards. And needles to say, this gaming laptop also comes inclusive of all the standard features found in other gaming laptops.

All in all, this gaming laptop is a real killer, however, you need to have lots of cash for this.

Asus Zenbook UX51Vz-DH71

What works for this Windows 8 gaming laptop is that it is really performance driven. The configuration offered by this gaming laptop includes: 2.1GHz Intel i7-3612QM processor, 8GB, 1,600MHz DDR3 memory and Nvidia GeForce GT 650M  2GB GDDR5 graphics.

With this configuration you can enjoy more than decent gaming performance. However, we wished that this laptop was touch screen enabled to take complete advantage of windows 8 interface. Nevertheless, this laptop has more than enough to be in our top 10 list.

Lenovo IdeaPad Y510p

Lenovo may not be one of the favorite brands among hard core gamers, but Lenovo idealpad Y510p is surely an exception. It comes with high performing processor, gamer-level graphics and also probably one of the best looking backlit keyboard amongst all current competitors.

On the flip side, this windows 8 laptop isn’t touch screen. Overall, Lenovo Idealpad Y510p laptop packs up more than enough to give decent gaming performance.

Alienware 14

Dell’s Alienware is one of the most trusted names in the gaming world. Alienware 14 again lives up to the high expectations of die-hard gamers. It gives a killing performance that any gamer would love to experience. However, the overall design looks very stale and outdated. And we also found the fan is a bit noisy, which can be an irritant while playing games. Nevertheless, the name ‘Alienware’ is itself more than enough to make up for its flip side.

Top 10 Best Gaming Laptops 2013: Dell Alienware

Configuration details: 14-inch, 1,920 x 1,080 screen, 2.4GHz Intel Core i7 4700MQ, 16GB 1,600MHZ DDR3 SDRAM and 2GB Nvidia GeForce GTX 765M.

Dell, who owns Alienware brand, also offers Dell Voucher Codes. With these Dell vouchers, you enjoy amazing discounts on all Dell products. Log on to the official website of Dell and get your hands on Dell vouchers and enjoy some amazing discounts.

Toshiba Qosmio X75

The good thing about Qosmio X75 – one of the top 10 best gaming laptops of 2013 – is that it gives all the high-end configuration at a reasonable price. Other great features of this laptop include SSD/HDD drive and Blue Ray Writer. On the flip side, the overall look is very disappointing, short battery life and also doesn’t have modern features like  Display Port and Thunderbolt.

But the fact that it offers high configuration at reasonable price has helped this laptop to qualify in our top 10 list.

Configuration details: 2.4GHz Intel Core i7-4700MQ, 16GB 1,600MHz DDR3 SDRAM and 3GB Nvidia GeForce GTX 770.

Razer blade

Fourth-gen quad-core Intel processor combined with good battery life has helped this gaming laptop to qualify in our top 10 list. On the flip side the laptop has a very corporate design and hence doesn’t come across as a gaming laptop. Nevertheless, a healthy configuration ensures that gamers will get mind-blowing gaming experience.

Configuration details: Intel 4th gen Core i7 Core i7-4702HQ / 2.2 GHz , 8GB Ram, 128 GB hard disk and Nvidia GeForce GTX 765M (2GB GDDR5) graphic processor.

Digital Storm x17

A high configuration coupled three-year warranty makes Digital Storm X17 one of the bests of 2013. But this laptop isn’t very pretty looking and looks very stale. Another disappointing thing is that it doesn’t have Nvidia graphic processor but AMD’s graphic processor.

However Digital Storm x17 packs up powerful performance thanks to its good configuration.

MSI GE40 2OC-009US

This not so expensive laptop delivers a pretty good performance. However, its inexpensive price doesn’t mean that it is low on configuration. It is packed with Intel Core i7-4702MQ processor and Nvidia GeForce GTX 760 GPU.

A low price tag coupled with solid configuration has what has got this laptop in our top 10 list of gaming laptops.

Samsung Series 7 Gamer

Samsung still may not be the big name in gaming industry, but this Series 7 Gamer laptop delivers pretty decent performance. It carries a great configuration. There are some minor flaws but that can be overlooked as the price tag isn’t that very high.

MSI GX60 1AC-021US

All those who are searching for a great entry-level game laptop, can fix their hands on MSI GX60 1AC-021US. It is a budget laptop that gives a pretty decent gaming performance on the go. It may not have the power of high-end configurations, but the performance is really good; good enough to make it in our list.

Die gamers who are fed up with playing games on computers and are dying to upgrade from computer gaming, this laptop is surely the best option for them.

Advertisement

Is Google Inc (GOOG) Android Safe? Not Yet: 99.9% Of New Mobile Threats Target Android [REPORT]

1

Kaspersky Lab’s report on the evaluation of threats targeting smartphones, tablets and other mobile devices that was published in February 2013 showed that in 2012 Android became the number one target among virus writers, and that the number of threats grew steadily over the course of the year. Did the number of mobile threats shrink in 2013? Not quite!

Attack on Android

January, traditionally being a quiet month for mobile virus writers – only 1,262 new modifications appeared in the first month of the year but by August, the number of fraudulent one-click apps published grew up to 2,500. That’s not all, Kaspersky Lab has detected over 20,000 new mobile malware modifications over the past few months. In February alone, 12,044 mobile malware modifications were detected, another 9,443 were found in March. To compare, a total of 40,059 modifications of malicious programs targeting mobile devices were detected over the whole of 2012.

SMS Trojans were found to be the most prevalent category of mobile threats and currently representing 63.6% of all attacks. These threats send text messages without the users’ knowledge to short, premium-rate numbers, leaving the users’ with hefty phone bills.

The Android platform remains popular among mobile virus writers. A total of 99.9% of new mobile threat detections target the platform.

Top 4 Malicious Programs

In the past quarter, first place for dangerous malware goes to Trojan-SMS.AndroidOS.FakeInst.a with 29.45% attacks. It was seen to primarily target Russian speaking Internet users who attempted to download software for Android devices from dubious sites. These dubious websites are often used by cybercriminals to spread malware under the guise of useful software.

The podium for second place goes to an adware by the name of Trojan.AndroidOS.Plangton.a (18.78% of attacks). This threat is prominent in European countries, where it is used by developers of free software to monetize products by displaying ads. SMS Trojans from the Opfake family stood at third and fourth places. The first modifications of the Opfake family of threats were disguised as the latest version of Opera, a popular mobile browser. Today, the malicious programs in this family are disguised as new versions of other popular apps (Skype, Angry Birds, etc.).

Kaspersky Labs also recorded two most interesting virus incidents in the last quarter:

  • A new threat going by the name of Perkel or Perkele was rumored to have allegedly attacked users in 69 countries. It was only detected several days later when the first modifications of Perkel began to appear. This particular threat hunts for mTANs (Mobile Transaction Authentication Numbers), uses text messages to communicate and upload stolen data to its command server. It is capable of performing self-updates.
  • The MTK Botnet, which was responsible for infecting up to one million Android devices primarily used by Chinese users. The spread of a malicious program in China was at the root of the botnet. It spread via unofficial Chinese app stores with popular, cracked games. It was developed to steal information about the infected smartphone, user contact data and messages. To do so, it hyped up a variety of apps: the Trojan could stealthily download and install apps on the victim’s mobile device and then give that app the highest possible ranking in the app store, thus increasing its visibility in the app store. Then they report their actions to a remote server.

As we are increasingly storing valuable data in our mobile devices, risk of banking or transaction numbers being stolen is increasing. Confidential business data stored in mobile devices are rarely encrypted or protected with a PIN. Growing use of “smart” devices in businesses as well as in personal lives, and the lack of awareness among organizations about mobile threats can lead to data leakage and misuse of important business or personal information.

And hey Android, get a real security update ASAP!

Source: Kaspersky Securelist Network

Advertisement

Apple Inc. (AAPL) Sold 9 Million New iPhones in 3 Days: Earns More Than What BlackBerry Was Sold For [REPORT]

0

On 23rd Sept, Apple Inc.(NASDAQ:AAPL) announced that it has sold over nine million new iPhone 5S and iPhones 5C in just three days after the launch of the new iPhones on September 20. Market analysts watched closely for patterns emerging due to the launch of these phones.

Apple did not release the sales breakdown for the iPhones 5S and 5C but it was speculated that the iPhone 5C’s sales will boost higher than the 5S variant due to its low price. Localytics, the leading analytics and marketing platform for mobile and web apps examined over 20 million unique iPhones and investigated the breakdown by United States carriers and global activations. It was interesting to see that the 5S variant of iPhone outsold the 5C variant by a factor of 3.7 worldwide in the first weekend it was available. In less than 3 days, the iPhone 5S and 5C now represent about 1.36% of all the total number of iPhones activated in the U.S. market across the top 4 carriers, AT&T, Verizon, Sprint and T-Mobile. 1.05% of all iPhones in the U.S. are iPhones 5S and just 0.31% are iPhone 5C, which means that the 5S outsold the 5C by a factor of 3.4x, that can be translated to 2.64 million iPhone 5C as compared to 6.36 million iPhone 5S.

Active-iPhones-Percentage-US

In the United States, where the consumers are richer and the difference in subsidized-price between the two was only $100, the inclination towards the higher-end iPhone 5S rather than the 5C which is nothing more than a re-packaged iPhone 5 with new software update is not unexpected. Moreover, the hardcore fans who want the highest-end phone the moment it is launched would have picked the 5S over the 5C.

AT&T-Most Preferred Carrier

So far, out of the top 4 carriers in the US market, AT&T saw the highest adoption rate for both 5S and 5C. Activations on AT&T represented 0.67% of all activated iPhones against 0.51% for Verizon, followed by Sprint (0.12%) and T-Mobile (0.07).

Percentage-of-Active-iPhones-by-Carrier (US)

Worldwide Adoption of iPhone 5S & iPhone 5C

It was not only in the United States that the iPhone 5S outsold the 5C, the pattern was seen to be similar globally. In some countries, e.g. Japan, sales of iPhone 5S outpaced the sales of 5C by a factor of 5x. However, it is not yet clear whether consumers in emerging markets are buying more 5Cs compared to 5Ss. It’d be interesting to see how the pattern changes in the next few days.

Active-iPhones-(Global)

Adoption Highest In The U.S.

As of 8 pm EST, Sunday, September 22, the percentage of active new iPhones was seen to be the highest in the United States, almost twice as much as all other countries and regions combined.

Active-iPhones-Global

Assuming the average base price of $649 for iPhone 5S (16GB Model) as $549 for the iPhone 5C (16GB), Apple earned an average of $1.44 billion from the 5C and $4.19 billion from the 5S. The average total earnings from both the 5S and the 5C could be $5.56 billion approximately. Apple generated more in revenues in just three days than what BlackBerry was sold for!!

Source: Localytics

Advertisement

5 Best E-commerce Software Platforms for Small Business

10

Today E-commerce business is definitely the most thing in the corporate world. There are thousands of start-up E-commerce companies across the world who are taking the cue from the fact that internet connection across the world is growing in leaps and bounds and cost of doing E-commerce business isn’t exuberantly high.

“There has been a sweeping change in the way consumers buy. Consumers have accepted e-commerce and it is the future of shopping.” says Latif Nathani, Managing Director of eBay India.

Here is a roundup of 5 best e-commerce software platforms for startup/small businesses. We think these 5 best E-Commerce softwares will definitely help your E-commerce business to stand out in the crowd.

Best eCommerce Platforms

Big commerce

This e-commerce website builder has many killer features that can make all the difference to your small E commerce website business. Some of these killer features of Big Commerce platform are mentioned below:

  • SEO optimized – means your e-commerce website will always be in top 10 Google search.
  • Designed with built-in marketing – integrated with discount and coupon codes e.g Indiatimes Shopping Coupons, complied with social media channels like Facebook & Twitter.
  • Awesome collection of themes – Big commerce gives you awesome collection of themes that will make your online retail store look simply awesome.
  • Comes with 60 payment gateways.
  • Is PCI compliant, means your online store will be protected from hackers and all your financial transactions would be 100% safe.

Shopify

This impressive e-commerce website builder can easily turn things for your e-commerce business. Here are some of the Shopify features:

  • Shopify comes with 14 day free trial.
  •  Uses Content Delivery Network – ensures your website is downloaded quickly & also ensures 99% uptime.
  • is SEO optimized & friendly, ensuring top 10 Google search for your website.
  • Comes with inbuilt Coupon Engine to create sales, discount codes and coupons.
  • Over 70 payment gateways
  • Comes with 128-bit SSL certificate & is PCI compliant – ensuring all your information and financial transactions are secure.
  • Comes with over 100 ecommerce themes & templates.
  • Comes with built-in mobile commerce shopping cart.

3Dcart

3Dcart is already an renowned brand in the e-commerce industry, specially known for providing low-cost packages for start-up companies. Apart from providing all the standard features like SEO optimized, payment gateway, ecommerce themes, 3D cart stands out for having a special department that helps you design a customized storefront – exactly the way you want.

Besides, it also has some high-end features like ‘Order processing’ & ‘Shipping’.

Miva Merchant

Miva merchant is one of the most trusted names in the e-commerce industry. The fact that Miva Merchant has sold licenses to more than 300000 customers speaks volumes about its trustworthiness in the e-commerce industry. Today the scale of its clients and customers ranges from a starup/small companies to MNC companies.

Besides all the standard e commerce features, what is really impressive is that it also has wholesale and retail options, giving customers options to choose from any of the two as per their business needs.

Yahoo Merchant Solutions

The fact that Yahoo is one of the biggest brand names in the internet world makes Yahoo Merchant Solution one of the most trusted names in the e-commerce industry. Today there are many small business owners and startup companies who are running thriving e-commerce business based on Yahoo Merchant Solutions.

Yahoo Merchant Solutions provides pretty same standard E commerce features, however it is the brand name of ‘Yahoo’ that makes all the difference

Advertisement

How Colleges And Universities Are Tapping 2 Billion Social Media Users ?

3

Colleges and universities are embracing social media as an exciting channel for students or prospective students of all ages. Nearly 2 billion internet users are on various social networks that includes 1.15 billion users per month on Facebook, YouTube at 800 million, Google Plus at 343 million and Twitter and LinkedIn follow, at 200 million each. While the brochures, mailings, and posters of yesterday are still found on some campuses—social media is replacing these archaic printed documents and changing the college recruiting landscape. With the use of social media platforms like Facebook, Flickr, Google Plus, LinkedIn, Pinterest, Twitter, and YouTube, to name a few, colleges and universities are reaching out to their students like never before.

Capitalize on Social Media

Through various social media platforms, colleges and universities are able to capitalize on high-visibility, low-cost solutions to accomplish their goals. At schools such as Penn Foster, SMU and Ashworth College, social media is providing the resources for:

  • Branding and presentation for the school
  • Career and job search services
  • Communication: ask questions, receive feedback, submit blogs
  • Community engagement and connecting with alumni
  • Expanding student access to educational opportunities, online schedules, and classes
  • Knowledge centers for extended learning
  • Student recruitment
  • Fundraising and political rallies
  • Sharing campus maintenance updates, security events, and other notes
  • Statistical infographics, educational games, and maps
  • Trade degrees, certificates, and high school diplomas

New or Returning Students Benefit

Students Use Social MediaWith an increasing number of prospective and returning students searching for state-of-the-art curricula, up-to-date facilities, and a progressive culture, social media opportunities benefit not only the colleges and universities but also these candidates. They establish a sense of belonging through social media for campus life, school culture, atmosphere, aesthetics, activities, and more.

The colleges and universities engaging in this type of outreach program will attract a generation of students who were using advancing technologies since their early years. It is critical to reach high schools students as well as a younger “connected” generation of prospective students, as we recognize a separate generation of retiring workers. Uversity quoted a Zinch and Inigral survey that claims 72 percent of high school seniors located colleges and universities using social media and that one-third claimed social media helped support their decisions.

Parents Get Involved

Parents are getting involved through social media as well. Their primary connections tend to be LinkedIn and Facebook, where most colleges and universities have presence. In the case of social media, the parents have opportunities to develop an opinion as well about the curricula, facilities, and culture of the colleges and universities their children are most interested in. In a Noel Levitz Research Report, it is noted that parents involved in social media are also very engaged with their children in college selection. Where social media is prominent, students and parents can expect a cutting-edge, connected college experience.

Advertisement

Breaking: BlackBerry Ltd. (BBRY) Sold For $4.7 Billion – An Underestimated Value ?

0

Troubled Smartphone maker Blackberry Ltd. (NASDAQ:BBRY) finally sold to a financial consortium for $4.7 billion. The long troubled smartphone maker – once the leader of Smartphone market – finally agreed in principle to be acquired by a consortium led by Fairfax Financial Holdings Ltd.

Blackberry Sold for $4.7 billion

Though the details of the acquisition is yet to be unveiled, market pundits have started debating about the underestimated valuation of BlackBerry which is struggling to mark its presence in Smartphone industry for last few years. Interestingly, the acquisition has come at the time when Apple is celebrating the record sales of its newly launched iPhone 5S and iPhone C; Is there any significance between the two developments? Yes, When Apple first introduced iPhone to market, analyst didn’t bet for it against BlackBerry – synonym of Smartphone then; today, AFTER SIX YEARS, BlackBerry finally lost on all grounds against Apple.

Technically, the deal is not done yet; according to agreement Fairfax can walk away from the deal anytime. The toronto-based financial conglomerate already owns 10% of BlackBerry common share. Just two back Blackberry announced to cut 35% of its man force (4,500 people) to reduce its growing losses.

The share value of Blackberry is already trading at its all time low value and the recent failed launch of Blackberry Z10 worked as the last nail in its coffin.

More details coming soon…

Advertisement

Games Still Popular Among All Apps: Google Inc. (GOOG) Revenue From Apps Increased by 10% [REPORT]

0

In the previous posts we saw that in terms of app volume, Android’s Google Play took the lead. On the other hand, in terms of revenue, it was Apple App Store that earned the most from apps. Over the last six months, the aggregated revenue of the Apple App Store remained mostly stable, however Google Play’s revenue was seen to grow by 61 percent when compared to the revenue at the end of March and August 2013. The combined revenue of both major stores grew by 17% over the past six months. In August 2013, the market shares for Google Play and Apple App Store were 35% and 65%, respectively. About 6 months ago, Apple App Store had a market share of 75% and Google Play had 25% market share. Although, Apple App Store continues to lead in terms of revenue, Google Play’s revenue is showing a consistent increase month over month.

The 10 leading countries that spend the most on apps continue to drive the revenue for each platform. The scenario hasn’t changed since July 2013. The US is still a big spender in the app market overall, followed by Japan and South Korea. Despite that there are no free apps offered in China on Google Play and the estimated revenue only relies on the iOS platforms, the country still ranks 5th in August 2013. The combined revenue from both iPhone and iPad was the largest in the US. Germany had the fourth biggest revenue portion in August 2013 for Google Play after Japan, Korea, and the US.

Top apps play an important role in driving the revenue upwards. Let us take a look at the top 5 apps in every segment.

App Market

Top 5 Free Apps

Apple App Store

In the free apps category, Gameloft’s Despicable Me: Minion Rush that topped the charts since July 2013 held its position throughout August. The second position was held by the hugely popular Candy Crush Saga by King.com which was closely followed by the new PopCap title- Plants & Zombies 2 which was also featured in the New & Noteworthy category across many countries in the Apple App store in August. The fourth and fifth positions in the chart were filled by Google, Inc.’s YouTube and Google Apps, respectively. The release of a new version of YouTube along with its being featured in categories like What’s Hot, New & Noteworthy, and College Survival Guide, amongst others, could be the likely reasons behind the increased download volumes.

Google Inc. was the top publisher in Apple App Store with two of its apps featuring in the top 5.

Google Play

Facebook app was once again the most downloaded app on Google Play in August 2013, followed by WhatsApp Messenger. Candy Crush Saga moved up to third position followed by another messaging app- LINE. The 5th position was filled again by Facebook Messenger. Messaging apps seemed to be most popular in August 2013 as Candy Crush Saga was only one game among the top five.

Google Inc. (GOOG)_App_Revenue

Facebook emerged as top publisher holding both the first and fifth position.

Amazon Appstore

Despicable Me: Minion Rush again topped the charts, overthrowing Where’s My Mickey? Free and Princess Hair Salon from top positions down to second and third positions, respectively. vTube – viewer and downloader for YouTube and Netflix ended up in the fourth and fifth positions respectively.

The free app charts of all stores show that non-game apps also have the potential to enter the top-five. Google Maps showed an increased popularity for Google Maps, which might have been caused by increased number of travelers during the summer. Dominating four out of five positions on Google Play in August highlighted the increased popularity of messaging apps. The increasing popularity of video streaming on mobile devices was highlighted by the presence of YouTube in App Store, in line with vTube and NetFlix on the Amazon Appstore.


Top 5 Paid Apps

Apple App Store

Minecraft- Pocket Edition by Mojang climbed up the top spot for the first time in the past six months. Following the leader closely was the August-released racing game, Asphalt 8: Airborne, that gained popularity very quickly. Another new app in the App Store was the Smart Alarm Clock: sleep cycles and noise reduction, which showed a 50% increase in download volume in August as compared to July. The removal of WhatsApp from the Paid Apps charts in July made room for other apps to move up. Pimp Your Screen and Pou moved up to fourth and fifth positions, respectively.

Google Play

Swiftkey Keyboard remained the number one app for six consecutive months since March 2013. Minecraft- Pocket Edition followed next pushing Titanium Backup PRO to number three. Nova Launcher Prime and Poweramp Full Version Unlocker took up the fourth and fifth position respectively. All these top 5 paid apps showed a growth in terms of paid downloads during August.

Amazon Appstore:

Minecraft- Pocket Edition continued to dominate the paid charts in the Amazon App Store as it was once again the most downloaded paid app. The following positions were filled by Plants vs. Zombies, Wreck It Ralph, which pushed Where’s My Mickey to the fourth position. Cut the Rope moved up to the fifth position of the top 5 apps in the Amazon Appstore based on an increase in paid downloads by almost 50% after being featured on the Amazon Appstore at the end of July

Minecraft – Pocket Edition proved itself as a worthy contender by staying at top positions across all stores, establishing Mojang as a top publisher. The conversion of WhatsApp into a free app made it possible for other apps to climb up, and doesn’t mean that those apps gained momentum because of increasing number of downloads.

Top Grossing Apps

Apple App Store

Candy Crush Saga, which has been holding on to rank one for two months was pulled down to the number two position by Clash of Clans again this time in August 2013. The featuring of Clash of Clans in the What’s Hot category in the Japanese App Store may have resulted in the second most revenue for the game after United States. Publisher of Clash of Clans, Supercell was still successful with its other title – Hay Day, defending its third position in the chart against Puzzle and Dragons at rank number four. The Hobbit: Kingdoms of the Middle Earth remained unchanged at number five.

Google Play

Candy Crush Saga remained at the top, followed by Puzzle and Dragons. LINE Corporation’s LINE Pokopang and LINE: Free Calls and Messages held the third and fifth position, while 모두의마블 for Kakao moved down one spot to fourth.

Candy Crush Saga and Puzzle and Dragons were the only apps common to both platforms. Games still are the most popular apps across all stores, but the number of non-game apps featured in the top 5 apps show the potential of useful and functional apps. App downloads have increased by 38 billion in 2013 and an increase of 36 billion is expected in 2014. Free apps still account for 91% of total downloads in 2013, and paid apps are expected to show a gradual increase in downloads.

Source: Distimo

Advertisement

Mobile Broadband Penetration in India Stands At 4.9%: Smartphones May Bring About A Change [REPORT]

0

With mobile subscriptions set to exceed 7 billion and overtake the total world population in 2014, it is expected that mobile broadband usage will soon reduce the dependence on fixed broadband for accessing the internet. Cell phones have lately become integrated with our daily lives as people are increasingly using their cell phones for everything from talking and sending text messages to shopping for goods and services, booking restaurant tables, etc. Internet via mobile opened up many new opportunities that may well serve as a bridge between the connected and the unconnected. Mobile broadband subscriptions overtook fixed broadband subscriptions in 2008 and rapidly increasing with a growth rate of 30% per year. It is expected, that by the end of 2013, there will be 2.1 billion mobile subscriptions, equivalent to one third of the total global stock of mobile cellular subscriptions.

New Divide

Mobile users will soon no longer be physically constrained by location, mobile phones have replaced the need to physically attend banks, post offices, and act as a gateway to money and communication services, as well as the online world of content bringing books, education and work to mobile phone users, whenever they want, wherever they want! However the World Economic Forum (2013) notes a lack of progress in bridging the “digital divide” that has emerged recently. Internet penetration isn’t very high in remote areas and in emerging markets. In low-income communities, a mobile phone subscription is shared between two or more people.

In emerging markets such as India, where a large population of people are first time users of technology, smartphone penetration stands at a mere 18%. According to the State of The Broadband 2013 report released by the United Nations Broadband commission, India is at the 106th position in the world in terms of mobile broadband penetration. Of the total population, only 4.9 percent users have access to mobile broadband services, leaving India behind countries such as Libya, Lithuania and Saudi Arabia. Although, the growth is significant when compared to last year’s 1.9%, India has failed to move up the rankings due to better performance by other countries. China ranks at 75th position with a penetration of 17.2%. In 2012, sales of smartphones out-paced the sales of feature phones for the first time, indicating the increasing adoption of smart devices in most markets.

We believe it is going to take a few years before LTE becomes viable in India in terms of availability of a wide range of affordable devices . LTE network CAPEX per Mbps and OPEX per MB also need to come down, and that will take some time: Manu Khera, VP, Mobile Broadband at Reliance Communications

There are numerous challenges that need to be overcome in order to provide internet access to all citizens across the length and breadth of the country. Some of the many challenges, as pointed out by Mr. Manu Khera were:

  • Affordability: India has a per capita monthly income of $100. The average Indian finds it difficult to invest in a broadband access device and pay monthly broadband access charges that are in line with the more developed countries, thereby limiting companies’ ability to invest in new technology.
  • Coverage in Rural Area: Coverage in rural areas is still very difficult due to lack of regular power supply, human population and broadband access devices. PC/Smartphone penetration is still very low to ensure viability of investment.

Mobile Broadband Can Be A Game-Changer

Smartphone subscriptions worldwide are estimated to exceed 4 billion by 2018, which currently stands at 1.5 billion. The smartphone industry is presently shipping 700 million smartphones a year, with around 40% of handsets shipped in 2012 being smartphones. By 2018, mobile broadband subscription is projected to reach 7 billion. 4G subscriptions are expected to grow ten-fold, from 88 million in 2012 to 864 million by 2017. In China, 75% of all internet users now access the internet via a mobile device, exceeding the proportion of users accessing the internet via a fixed connection (71%) for the first time in 2012.

Mobile Broadband Bridges the Gap: Fixed Broadband and Mobile Subscriptions, 2009-2018Figure: Mobile Broadband Bridges the Gap: Fixed Broadband and Mobile Subscriptions, 2009-2018

Source: Ericsson Mobility Report, June 2013.

India is one of the first countries to launch LTE (Long-Term Evolution), which will accelerate service delivery in sectors ranging from health to public infrastructure and will drive significant structural shift in consumer behavior over the next few years, given that nearly 200 operators in 75 countries may offer LTE services by the end of 2013.

Low-cost offerings by local smart devices vendors are rapidly bridging this gap with entry-level smart devices. These smart devices are soon gaining popularity among Indian consumers and are expected to increase smart devices penetration in the country, thereby paving the way for mobile broadband.

Source: Broadband Commission, Telecoms

Advertisement

1.1 Million BBM Downloads In First 8 Hours; Alas, None Is Going To Work !

0

It’s a mix of good and bad news. Let’s start with the most fascinating aspect of both; No matter how bad or ugly scenario were faced by BlackBerry Ltd. (NASDAQ:BBRY), Smartphone users are immensely excited about BBM – irrespective of on what Smartphone OS are they. More than 1.1 million of Android users went ahead to install ‘unreleased’ version of BBM within 8 hours from the scheduled launch of official BBM app for Android.

Amazing, isn’t it? Probably, this is what that made BlackBerry to set up BBM as a separate entity; Yes, I am sensing a real intelligence here. Anyways, here is the bad part of the whole story; BlackBerry has deactivated all BBM on Android installs as the company feels that product is yet to reach its perfection level.

BBM app on Android

BlackBerry has paused the global roll out of BBM on Android and iOS, previously scheduled for 21 September and 22 September . However, iPhone users who got hold of BBM, via any mean of unofficial roll out, could cheer as company has decided not to deactivate BBM app meant for iPhone.

Analyzing the whole scenario, people familiar to matter claimed that it’s better to stay refrain from BBM for now atleast. There could be enough possibilities that BBM is yet a untested or unfinished product tailored to Android and iOS.

BlackBerry Messenger (BBM) app is a mobile messaging app considered to be the most secured communication app. Limited to BlackBerry OS till some time back, the app will now become an independent app to be available on all mobile platforms competing other most successful apps likes of WhatsApp and WeChat. Considering the response to unofficial release of BBM, it would be a good fit to read the comparative analysis before one decides to jump off the ship.

The company is yet to announce the new date for the official release of BBM and all Android users who have BBM on their device now, will have to register on the site to get new update to make BBM work.

Advertisement

Nimbuzz, WhatsApp And WeChat Together Serve 750 Million Users: Can BBM Earn Back Users?

0

When BlackBerry Ltd. (NASDAQ:BBRY) announced that it is going to launch BlackBerry Messenger (BBM) for both iOS and Android platforms, questions flooded our minds about whether it was the right move for the company and whether it’ll be able to regain its former glory in a market which is now brimming with several cross-platform messaging apps.

BBM for Android & iOS

As BBM will be launched for Android today, let us analyze the instant messaging services market one last time prior to its release.

Currently, there are a number of instant messaging services available. Most of them are available cross-platform. Many have introduced features that weren’t available in conventional instant messaging services like the use of stickers, ability to play games with friends, group chat, etc – which have significantly intensified the competition among these services lately. We picked WeChat, Nimbuzz and WhatsApp for this study.

Lets talk about Nimbuzz first: In March, 2013 Nimbuzz claimed to reach 150 million users, Asian users accounted for 60% of its total user base. Nimbuzz currently has its presence in over 200 countries. In India Nimbuzz has a user base of more than 25 million with an average user engagement of more than 120 minutes per day. Nimbuzz responded to growing popularity of instant messaging services by quickly adapting to other platforms like iOS, BlackBerry OS, Android, Windows Phone,  etc., that has contributed to its growing user base as smartphone penetration increased.

Nimbuzz

App Size: 11.95Mb (Play Store, Sept 10, 2013)

WhatsApp quickly went viral after it was launched. In India, WhatsApp quickly replaced the subscription based-BBM. WhatsApp’s easy-to-use, highly customizable UI and the ability to share photos, audio clips, etc made it quite popular among users. Users who thought adding contacts to messaging apps is a hassle preferred WhatsApp because it could automatically add contacts (who use WhatsApp) from users’ contact list into the app’s contact list. It was also quickly made available to all known mobile platforms. On August 6, 2013, the company claimed to serve 300 million active users globally, with 250 million monthly active users(MAU). WhatsApp has 20 million users in India at present. As competition among messaging services increased, other cross-platform messaging services provided newer features like video chat, sticker-messaging, etc, while WhatsApp still offered the same services, it added voice messaging feature only recently, almost all other messaging services had already integrated this feature long before WhatsApp.

WhatsApp

App Size: 10.05Mb (Play Store, Sept 10, 2013)

WeChat is currently the most popular instant messaging service in the world with nearly 400 million registered users. It serves about 100 million international users outside China. The number of monthly active users reached about 195 million. Popularity of WeChat grew due to the array of new features it provided – like stickers, web chat, Moments, Live Chat, Drift Bottle, Shake, etc.

WeChat

App Size: 22.69Mb (Play Store, Sept 10, 2013)

BBM: BlackBerry’s Ray of Hope?

The need to have a BlackBerry device to be able to use BBM bothered most users and many drifted towards these cross-platform instant messaging services. BlackBerry tried desperately, with the help of numerous ad campaigns to retain users, but in vain. Had they looked around themselves more closely, and developed BBM for other platforms early-on, they wouldn’t have lost so many loyal customers.

Let us not concentrate on what is lost and try to focus on what is left for BBM. BlackBerry currently has 60 Million users worldwide, who exchange 10 billion messages per day. User engagement is also very high as nearly half of these messages are read within 20 seconds of being delivered.  While BlackBerry will make BBM available for Android OS today, iOS users will get it tomorrow. There is still no word of a BBM for Windows Phone though. This may be BBM’s one chance to prove itself in a market of more than a billion smartphones, with no dominant messaging service. The faster it spreads across all platforms, the better are its chances of survival. BBM recently integrated voice chat (BBM Voice), video chat (BBM Video), BBM Channels and BBM connected apps that lets users to follow notifications and post update on social networking sites. BBM for iOS and Android will initially include chat, photo and voice note sharing, multi-person chats with up to 30 people, and the ability to post status updates and personal messages, however BBM Video and BBM Channels will only be available in a future update.

Security has always been BlackBerry’s greatest strength. While some users dislike the lack of security in apps like WhatsApp and Nimbuzz, BlackBerry can leverage its security features to gain back those users, provided it makes newer features available soon.

The surfacing of a fake BBM app on Android Play Store had caused havoc among users who thought it was the real deal. Hope this doesn’t affect the real BBM’s download numbers when it is actually available for download.

Advertisement

Apple Inc. (AAPL) iPhone 5: Fastest Smartphone Ever Made! [REPORT]

0

It’s always funny to see fanboys from both worlds – iOS and Android – going to war in the comment sections of tech-media articles. The thrashings, the swearing and the use of sarcasms often make these comments more interesting than the articles. I prefer to be a bystander and listen to their claims and accusations while trying to differentiate the truth from ignorance. I’ve seen many claiming that their iPhone is faster than “any” smartphone ever made, others claim that their Samsung S-(whatever) is so fast that it’ll leave iPhone eating dust. Some say iPhone’s screen is “puny”, defenders say they sometimes mistook a giant screen smartphone for a tray – and so it continues! Everything from build quality to screen size to battery backup become weapons in these wars.

Agawi decided to find out if touchscreens of iPhone from Apple (NASDAQ:AAPL) were really more responsive than Android smartphones, as so many Apple lovers claim? To be able to measure accurately the App Response Time (ART) i.e. latency from the time the user feels that they have touched the device to the time the user sees a response on the screen, a combination of high-frame capturing at 240fs and custom hardware was used. The team built simple, optimized apps to flash the full screen white as quickly as possible in response to a touch, the apps contained minimal logic and used OpenGL/DirectX rendering to ensure the response was as quick as possible.

To make the comparison fair, six top smartphones were taken – iOS based iPhone 5 and the iPhone 4S, Android based Galaxy S4, HTC One and the Moto X and the WP8 based Lumia 928.

Here are their findings:

The iPhone 5 recorded the fastest response time of 55ms! That’s not all, it was followed by the iPhone 4S with an MART (Minimum App Response Time) of 85ms. All the Android devices’ MART fell in the 110-120ms range. The Lumia 928 WP8 based smartphone showed better response time (117ms) than HTC One’s 121ms and Moto X’s 123ms.

Apple iPhone 5: Fastest Smartphone with Minimum App Response Time

The iPhone’s code which is written in Objective-C as opposed to Android and WP8 code that ran on runtimes (Dalvik and CLR respectively), may have reduced some latency in addition to better optimization and/or more sensitively calibration of hardware for capturing and processing touch.

The conclusion was loud and clear – the best written apps on iPhones will simply feel more responsive than similar apps on the current generation of Android devices.

Apple lovers just got something to brag about!

Source: AppGlimpse

Advertisement

Global Mobile App Downloads Projection 2013 – 2017: Paid-For Apps To Account For 9% In 2013 [REPORT]

3

It is expected that the total revenue from mobile apps will show an increase of $8 billion from last year to $26 billion in 2013. App downloads were seen to be increasing all throughout the year. Number of downloads is expected to reach 102 billion in 2013, a significant increase from 64 billion downloads in 2012. Free apps will account for 91% of total downloads in 2013. In-App Purchase (IAP) is expected to account for 17% of the total revenue from app market in 2013. Out of the $26 billion expected revenue, $8.8 billion is expected to come from tablet apps. This further highlights the growing popularity of tablets among consumers.

Number of app downloads is likely to show strong growth through 2014, as number of smartphone owners increase, but the trend will possibly exhibit a slowdown in later years. This is likely to happen as a result of users becoming more aware of the apps they want and using the same portfolio of apps more often rather than downloading new ones.

IAPs To Gain Momentum

IAPs are showing promising growth and are likely to be a major monetization method for app stores and developers. By 2017, IAPs is forecast to drive 48% of revenue from apps. IAP contributes to a significant amount of Apple Inc. (NASDAQ:AAPL) App Store revenue from iPhones worldwide. While other platforms haven’t reached such high levels yet, analysts believe IAPs contributions will exhibit an increase in the future. However, from the perspective of downloads, IAP is likely to have a strong growth in 2013 and 2014 but will slowdown in later years due to increasing smart device penetration in mass-markets where consumers’ willingness and/or affordability to spend on IAPs is lower than early adopters.

“We see that users are not put off by the fact that they have already paid for an app, and are willing to spend more if they are happy with the experience, as a result, we believe that IAP is a promising and sustainable monetization method because it encourages performance-based purchasing; that is, users only pay when they are happy with the experience, and developers have to work hard to earn the revenue through good design and performance.”: Brian Blau, research director at Gartner

Global Mobile App Store Download 2012 - 2017

The chart above shows the increase in number of downloads. In 2013, app downloads have increased by 38 billion. In 2014, an increase of 36 billion is expected. The growth rate will keep increasing till 2016 but will fall slightly in 2017. We can also see that the number of free downloads will increase rapidly, this can be an indication of higher penetration by smart devices in emerging markets. The number of paid app downloads will also show an increase, although the rate of increase will comparatively be slower, indicates that more users will become aware of apps they want to use and demand of quality apps will increase as markets would have seen a higher degree of penetration.

Revenue Vs. Download Count

Apple’s App Store and Google (NASDAQ:GOOG) Android’s Play Store are currently the two largest app libraries. Although both ecosystems offer free as well as paid apps, Android has more free apps (80%) than iOS (60%). It was seen that Android users download more number of free apps but iOS users don’t mind paying for apps provided they get a good experience. Both the platforms have their own different target markets and cater to specific demographics. Apple products have a smaller user base as compared to Android, but are more focused in mature markets, where users are more well-informed and choosy about the quality of apps. Android phones have undoubtedly penetrated more markets and have a larger user base compared to iPhones, However, a large percentage of Android users come from Asia-Pacific region which are abound with price sensitive markets like China and India. Users from such markets are more likely to download free apps. While Android has more number of downloads, iOS generates more in terms of revenue.

SOURCE: Gartner

Advertisement

Behaviour Of Smartphone Users Can Change The Future of Retail In Asia [REPORT]

1

There was a time when the word ‘smartphones’ triggered a spell check in computers, usage of the word is fairly common among people nowadays. It is a word that changed the way we used to look at our phones. Calling, messaging and listening to music are not the only things we do on our phones nowadays. The number of smartphone users is ever-increasing all over the globe. Many markets, especially the developed ones like US and UK, have already reached a point of saturation, where more than 50% of the population now owns a smartphone of some kind.

smartphone penetration

Smartphone penetration in developing markets of Asia-Pacific region is booming. And in a number of markets in the region are already reaching saturation points. The difference between these markets and the markets that have not yet been penetrated to such an extent is so stark that the whole region can be divided into two categories – Developed Asia and Developing Asia.

The Changing Behaviour Of Smartphone Users

Hong Kong, Singapore, Malaysia and Australia fall in the category of Developed Asia, while China, Thailand, Indonesia, India and Philippines can be categorized as Developing Asia. The growth in the ownership of connected devices in these markets are expected to level out in the near future, however, consumer use of these devices will continue to change, evolve and expand – presenting vast opportunities for organizations to engage with consumers. Developing sophisticated mobile strategies designed to leverage changing connected device behaviours and cultivating ongoing consumer engagement is therefore becoming very critical for companies than ever before.

A new research by Nielsen highlighted that in Southeast Asia alone, smartphone users spend an average of three hours per day on their smartphones (June 2013). Users were seen to be spending the most time using their smartphones for chatting, social networking and entertainment activities like games and multimedia, which has been a result of improvement in smartphone functionality, along with consumer awareness and knowledge of handset functionality.

Some other findings from the research were:

App Usage:

App usage is increasing, even though smartphone penetration hasn’t reached 100%. In Asia-Pacific, apps for games, social networking and multimedia are among the most used. 86% of Chinese smartphone owners played games on their smartphones in the last 1 month.

Consumer behaviour: App Usage

 Mobile Video Viewing:

Viewing of videos via smartphones is gaining traction too, especially in more developed markets like Hong Kong and Singapore. Consumers who are watching mobile videos on their mobile handsets are doing so more than 10 times per week on average. 42% of Indian smartphone owners watch videos on mobile handsets.

This highlights exciting opportunities for marketers to build strong and lasting connection with users.

Consumer Behaviour: Mobile Video Viewing

M-Commerce:

Consumers in the region, especially in markets like Korea and Japan are increasingly engaging in mobile commerce. About 89% Japanese consumers and about 67% of Korean consumers engaged in mobile commerce activities in June 2013.

Although mobile commerce is still largely untapped in most markets, but as this technology wave catches, markets like Hong Kong, Singapore, Malaysia and Australia may emerge as the next big mobile commerce markets, which will play critical role in shaping the future of retail in Asia.

consumer behaviour

Mobile Advertising:

The increase in smartphone usage is also paving way for advertisers to connect with consumers. Although, mobile advertising is still in a nascent stage, especially in markets like India and Philippines, where smartphone penetration stands at 18% and 15% respectively, many companies are experimenting to see what works best and what doesn’t. Receptiveness to mobile ads is growing in Asia-Pacific. Though it is an exciting opportunity for advertisers, they should focus on providing an engaging experience that doesn’t interfere with users overall mobile experience.

Although the opportunities are numerous, it is very crucial for marketers to understand changing behavior of smartphone users. Success will largely depend on understanding the challenges and identifying the opportunities, as well as the drivers and motivators of mobile behavior.

SOURCE: Nielsen

Advertisement

Apple Inc. (AAPL) Fails To Catch Up With Google In U.S. Smartphone Market In 2013 [REPORT]

5

Smartphone penetration in the U.S. is at an all time high. Between June and August, 15 percent of smartphone owners said that they acquired their handsets within the last three months, bringing smartphone penetration in the US up to 64% – an increase of 3% from last quarter’s 61%. 80 percent of the recent owners chose smartphones as their mobile handset.

Is The Market Stagnant?

Highest penetration of smartphones (81%) was seen among young adults in the age bracket of 25-34, and teenagers aged 13-17 are catching up fast; nearly 70% of teens in the US now use smartphones. The lowest penetration of smartphones is seen among those above the age of 55. People in this category amounted to 50% of mobile subscribers who still use feature phones. While some analysts observed these stats and stated that the smartphone market in the US has matured, others believe that being able to penetrate into the 55+ age category will open up significant room for smartphone growth.

Battle For Market Share Continues Among Top OSs

As of May, 2013, Google Inc.’s (NASDAQ:GOOG) Android was seen to be the leading mobile operating system, with 52.4% smartphone OS market share.

US-Smartphone-Market-Share

The above graph shows the changing trend in market share by mobile OS in the US. It can be seen that Android has been showing a steady increase: from 51.7% as of Feb, 2013 to 52.4% till May. In the period June to August, this figure has increased to 53%. Apple’s iOS shows a similar trend, its market share rose by 0.3% from 38.9% in February to 39.2% as of June, 2013. Another 0.8% increase was seen in the period June to August. BlackBerry’s declining market share shows no improvement: As of February, 2013, it held a market share of 5.40%, which fell to 4.8% by the end of June. During June to August, its market share further declined to a mere 3%. Microsoft’s Windows Phone is suffering the same fate as BlackBerry – from 3.20% market share in Feb, 2013, it fell to 3% by the end of June. Currently it holds a 2% market share in the US.

top smartphone OS by market share (US)

Android continues to lead this market with 53% of smartphone owners running Android handsets during June to August. Apple Inc. (NASDAQ:AAPL) on the other hand, remained the largest smartphone manufacturer with 40% smartphone owners. Among recent acquirers, more than 90% purchased either an Apple or Android device, with 61% of consumers going for Android and 34% picking iPhones.

SOURCE: Nielsen

Advertisement