
People are attached to their smartphones way more than they’re to any other gadget. In fact, the average person checks their smartphone 85 times a day and spends more than 5 hours a day on their pocket companion. As smartphones have evolved through the years, so has the interaction times of the users with their device. We now stand at the cusp of an entertainment revolution where an average smartphone owner spends a mere 4 hours a day on the TV, a full one 1 hour 18 mins less than the time spent on their mobile devices. Thus, it comes as no surprise to us that the latest report from Ooyala for trends in Global Video Service and Consumption for Q1 2016, shows remarkable growth for the OTT content market.
However, with several new players like Hooq, iFlix and Hayu stepping into the market as well as older giants like Netflix and Hulu changing their gameplan the dynamics of the OTT landscape are set to change very soon. As it is very often seen with a budding industry the revenue models and Quality of Service are still being worked out by the players. In today’s analysis, we discuss the strategies that must be followed by this blooming industry if they’re to stand a chance against the behemoth that is cable TV.
Subscriptions Vs Ads: Who Will Win the Online Video Monetization Battle?
Online videos can be tough to monetize and as such there is an ongoing debate between publishers about the merits of Ad based services (otherwise known as AVOD) as opposed to SVOD (subscription-based video services). While the popularity of YouTube and the stars on their platform have made it clear that AVOD has a very promising future, the Ad based model of the Internet is under threat from Ad Blockers. Even video content is not spared by the new age blocking as we will see later on in our analysis.
In order to combat this problem, we have moved towards subscription-based video services and we see that even YouTube has taken the same step with YouTube Red. Netflix has for long followed the same model, and we find that it becomes very interesting for us to cast a closer look at the demographics of the two categories of online content and have a clear idea of what their mode of consumption of online entertainment is.
For subscription based videos, we find that mobile devices have a lead with smartphones at 44% and tablets with 11% taking a commanding lead of 55% over PCs. However, PCs although losing out with 45% of the views on SVOD, come back strong by reclaiming top spot with 55% of views for AVOD. Smartphones came up second with 39% of the views while tablets struggled; managing a meager 6% in this category.
We see that subscription based content, which is generally associated with long form content is watched primarily on mobile. Also, the completion rate is much higher for SVOD as we see that in mobiles, long time content’s viewing time ranges from 97.7% and goes consistently up as the screen size increases hitting a massive 99.9% for connected TVs.
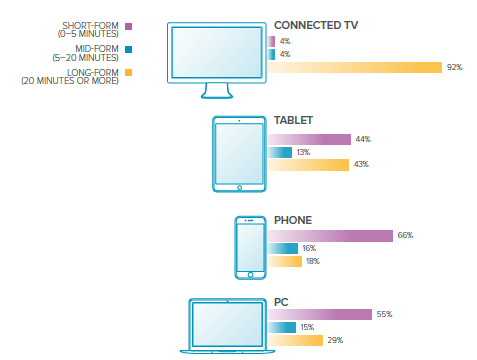
However, the situation is completely different for AVOD as we see from the graph to our left that it varies quite a bit from device to device in terms of watch time. The general principle though that larger screens are better for longer forms of content holds true here as well. This is why we see that 2 out of 3 short form (lesser than 5 minutes) AVOD videos are watched on smartphones. On the other end of the spectrum, we find that 92% of the longer form of Ad supported videos are watched on connected TVs.
Interestingly enough, while people have continued to consume long-form written content with gusto on smaller screens, we find that the same trend doesn’t hold true for video content. However, one of the main concerns for AVOD video publishers for the last couple of years has been the advent of Ad Blockers. We see how anti-Ad Blocking mechanisms have been saving their skin in the next part of our analysis.
We reached out to some of the industry experts to know their views on growing OTT market and the effective monetization mechanism of OTT content industry. Mr. K.A. Srinivasan, Co-founder of Amagi Media Labs, believes that it is going to be a hybrid model and very market specific. He segments the overall market into three buckets:
- Premium markets (like US/UK): Predominantly subscription driven, with advertising subsidising the subscription.
- Pay-TV markets (like India): Basic-tier will be ad driven, with subscription for premium content.
- FTA (Free-to-Air) TV markets (like Indonesia, Malaysia etc.): Predominantly ad driven.
“As in the case of existing TV, most TV channels started as FTA and migrated upwards to Pay-TV. Only 260 of 900 odd channels licensed in India are Pay-TV. We will most likely see the same trend, most offering free content first and then migrating to subscription (transactional or subscription) for their most popular content – the advantage for TV networks with this approach, is that they get the best of both worlds – advertising revenues AND subscription revenues.” says Srinivas.
Blocking the Ad Blockers: The Content Creators Fight Back
Although Q1 has traditionally been a slower quarter for advertisement revenues, we have witnessed a 74% increase in paid impressions as a direct cause of a jump in premium content to the tune of 22% was made available during this time frame. Ads have also been noticing higher returns as we have seen that average CPM is on the rise with a 13% increase QoQ. Most of the increased revenue from ads though is because of the introduction of Anti Ad-Blockers, a new technology that circumnavigates the Ad Blocker problem and has managed to boost Ad Impressions by as much as 23%!
 Even though Ad Blockers primarily affect websites with written content, initial estimates point to a loss in $27 billion in ads by 2020. And a large portion of that gigantic number will be revenue lost from online video content as we are set to consume a huge amount of online video in the next half a decade. Nearly 70% of the data consumption on mobile by 2020 will be due to video consumption and with the increase in mobile-based ad blockers and browsers with Ad-block enabled by default, this is a scary situation indeed.
This is why Ad Re-insertion is a significant step forward in the mobile ad battle as even premium content streamers have seen that their ad impressions have improved by as much as 15% after using Ooyala’s ad re-insertion plugin. This, in turn, translates to millions of dollars in revenue for large scale permissions per annum as we find that for a publisher with 43 million impressions per week can increase their payout by $148,350 and $247,250 a week (using CPMs of $15 and $25 respectively).
Effectively that means $7.7-12.9 million in excess income annually. The increased payout even for a smaller broadcaster with around 7 million hits weekly is around the ballpark of $1 million to 5 million.
However, as we have mentioned quite a few times before as well, blocking the ad blockers or circumnavigating them is not helping us solve the problem to any extent. In fact, if ads can be made appealing enough for consumers, not only would conversion rates be higher; but video engagement would shoot through the roof as well. This is why in our ending portion, we figure out what the audience expects from such services and where the standards of Quality of Service from Online Video Providers are being pegged at.
Final Thoughts on The Future of the Online Video Industry

As global ownership of smartphones head towards 50%, we are at the edge of a landslide in the entertainment industry. In Q1 2016, 48% of all videos were played on mobile devices (phone + tablet), a 14% increase YoY and a 129% increase from 2014. This shows that despite the fact that smartphone sales have had a torrid time in the first quarter of 2016, the increasing nature of services being more focussed on smartphones are here to stay! One of the more interesting facts that have been brought to light has been the fact that tablets have seen increased usage in the last quarter standing at 18% of all viewership, a 4 percent point increase QoQ from Q4 2015.
While this is good news indeed for tablets, we will leave the question of the resurgence of tablets as a separate issue to be dealt at a later date. For now, with the focus being firmly on mobile video content consumption, let us have a look at some of the important points play a determining role for the audience of this industry.
Buffering is the Biggest Enemy
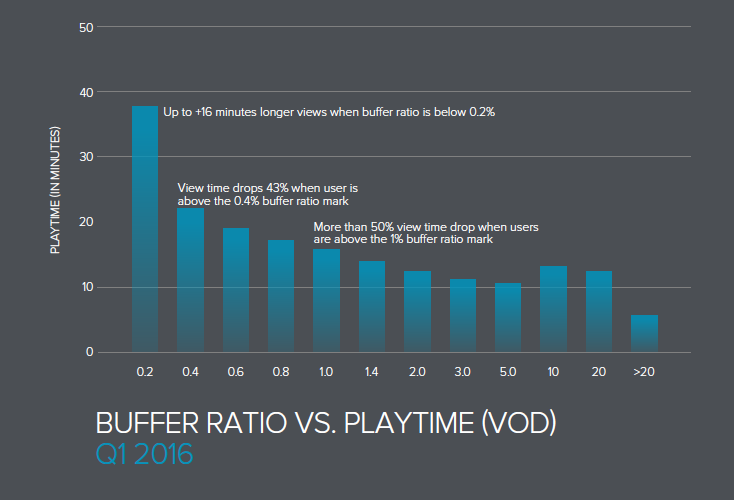
Even in the online video space, there are multiple types of content ranging from genres to when they are broadcast. And while it is outside the scope of this study to show viewership drop off as a result of Quality Loss across genres, what we have is some very interesting data that shows us the viewership comparisons between Video that have been uploaded to a platform vs. live streaming. In the recent past, Facebook and Twitter, two of the giants of the social media space has been jostling for space with already established streamers like Twitch for a piece of the live streaming pie. Why? The simple answer is because people are more forgiving about Quality issues for live streams.
This is clearly observed as the Buffer ratio of below 0.2% can lead to more than 2 hours of excess watch times for live streams, there is a loss of 40% of the audience when this ratio jumps to 0.4%. Taking a look at VOD, we find that while buffer ratios below 0.2% are critical, the extent to which they affect is much lesser; increasing view time by an average of around quarter of an hour. However, the real change in numbers is unearthed when we look at higher buffer rates as we witness the drop in view times increasing from 43% to over 50% as the buffer ratio for VOD goes from 0.4% to 1%.
Bit Rate and Join Time Also Plays a Part
The same trend continues in Join Timing as people are willing to spend around 25-30 seconds with an online live streaming video before there is a sharp drop off of around 40% viewers. For most of the VOD content, the margin for error is even smaller as 40% of the audience drops off around the 6-second mark. The size of the screen size plays an important role here, although the results can be a bit surprising. On mobile, the drop off rates seems to be significantly lower than on TVs and PCs which gives us a strong indication that the mobile viewing experience is much better for most users.
While bit rates are not really a big factor yet, as we see higher resolution screens on our smartphones, we assume that this will play an even more important factor in the QoE of online Video. For now, a bit rate of above 2.8 Mbps is considered par for the course with higher quality streams gaining better watch times.
Discovery Still Remains an Issue
With huge platforms like YouTube providing the stage for thousands of content creators to show off their work, it can become downright tedious for the consumer to find content that appeals to them. Even companies like Netflix and HBO keep on adding newer shows to their repertoire bringing content libraries to gigantic proportions. To combat that, viewer specific recommendations becomes one of the best ways to keep the user engaged with the type of content they prefer.
On an average, out of 10 times, the audience has been found to click on the suggested video about 4 times which pegs the discovery rate at 40%, a metric that has remained almost static over the past year. Every 1 out of 10 videos played was from the suggested categories, which means that there is a definite room for these automated suggestions to get more in tune with what the audience wants to see.
In spite of all of these, for online video to truly rival Televisions, one major factor has to change. On televisions there is no way to block the ads and while the one downside to traditional cable TV is the fact that they’re not geared towards each specific user’s need, they are still very viable as an advertisement platform. And while brands are expected to pour in $114 billion on the mobile advertisement by 2018, it will still remain a distant second to the $215 billion spent on TV ads; unless we can address the issue of Ad Blocking properly.
“Adblocking is an exceptionally important issue facing all digital content creators. Blocking the ad blockers at the point of engagement with websites is an option in the short run, but in the long run the solution probably lies in advertising that moves away from clutter, from CPM-based selling, to premium solutions.”- says Chris Llewellyn, CEO, International Federation of Periodical Publishers (FIPP)
With an estimated CAGR of 32% over the next couple of years, online video seems to be ready to take on the TV industry head on in the next half a decade’s time. But can it defeat the wizened King of the Entertainment Industry? With mobile gaming in tow, the ‘smart’phone in our hands looks all but ready to rage an all out war on the ‘idiot’ boxes in our homes! Can the age old technology stand its ground or will it be lost in the sands of time? Only the future can tell!
