
It’s a tad cliché and true that smartphones have permeated every sphere of our life. The ceaseless tech breakthroughs have led to a churn of smartphones all around. And given the number of resales spawned by the manufacture of hefty cell phone numbers, it is only fitting that the people get the best deals. An emerging study looks to do just that – enhance essential knowledge of consumers looking to leverage the value of their old smartphones in trades and upgrade.
Cell phone trade-in site BankMyCell’s latest report has come with an assortment of fascinating observations for those looking to indulge in some smartphone flogging in the coming year. The report, compiled after tracking 310 device resale values from multiple vendors (on an hourly basis), shows which smartphones are most likely to sap their resale value by the trifecta of the brand, model, and operating system.
Keeping a close watch on all smartphone activity through the year 2020-2021, BankMyCell’s notable observations for the year’s biggest winners and losers were made thus.
Starting out categorically to cover some of the most significant stats, let us glance through the bouts one by one to gauge the extent of the report’s findings.
Bout 1: Flagship Android Devices Depreciate Double the Rate of iPhones:
Contrasting the flagship Android and the plum iPhone devices in gap terms of one, two, and four years, the information which came to light tells us how depreciation rates are skewed towards the flagship Android offerings.
• When considering for one year, the current average depreciation of a new iPhone’s trade-in value came out to be -16.70%, as compared to Android’s -33.62%.
• In two years, the current average depreciation of a new iPhone’s trade-in value was reported at -35.47% in comparison with Android’s -61.50%.
• After four years, even though the figures try reaching even keel, iPhones still lost an average of -66.43% of their initial buyback value, which is quite lower than Androids -81.11%.
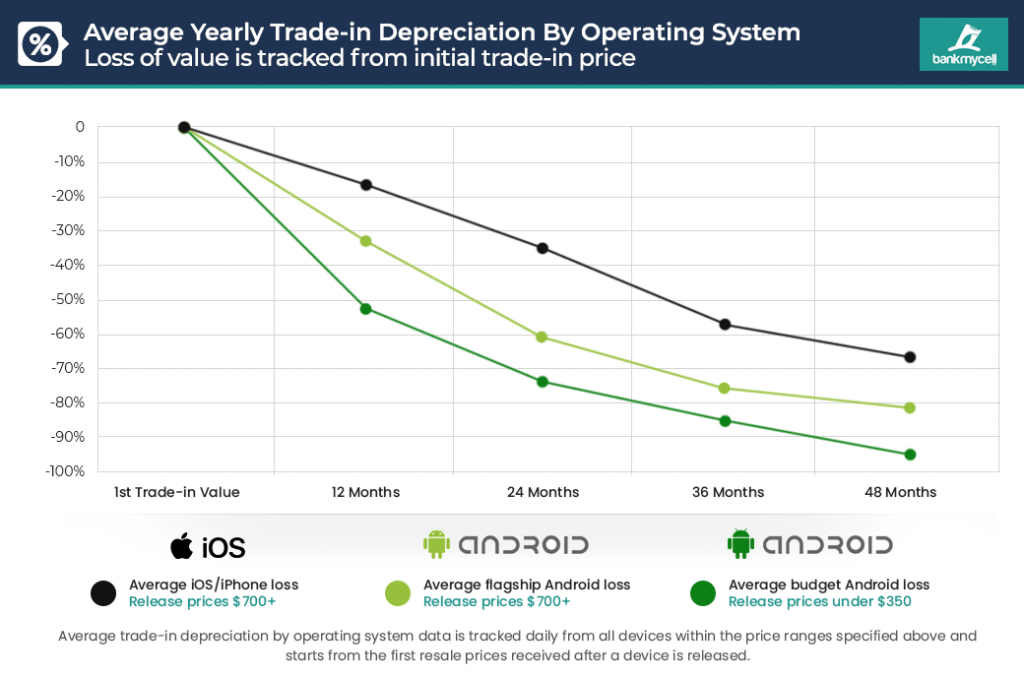
Bout 2: Budget Android Devices Lose an Average Of -52.61% in Year One
Moving into the budget Android smartphone devices, the observations look on the dire side.
It was found that on average, Android devices with launch prices sub $350 lost as much as half their trade-in value in just one year. The owners of all prevalent budget smartphone brands like Samsung, Motorola, LG, HTC, and Google reported losing an average of -52.61% of their trade-in value in 2019-2020.
• Considering by gaps year-wise, the resale value of budget Android smartphones were slashed by -73.61% in the first year, -85.15% over a two year period, and a whopping -94.90% from initial to the fourth year.
• In some examples cited by the report in this category, the Samsung A50 reportedly lost -79.94% of its trade-in value from March 2019 to December 2020.
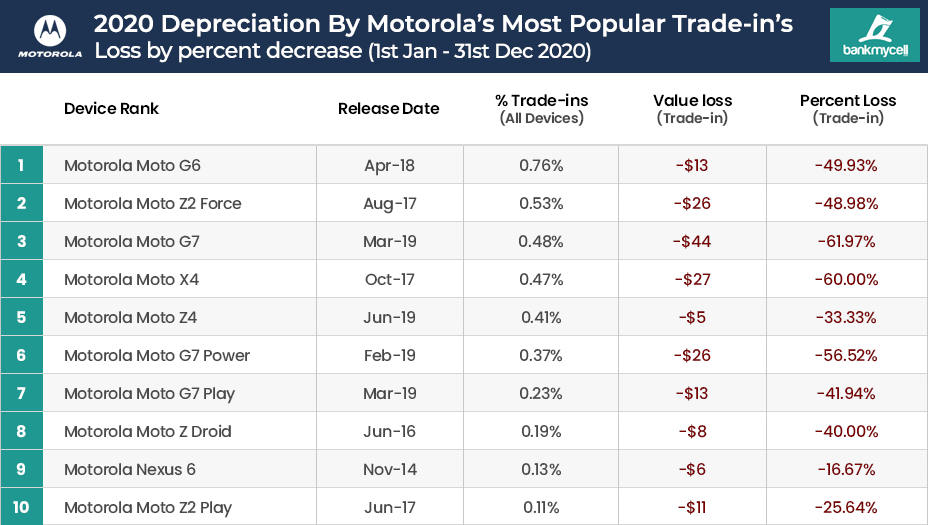
• Another one, the Motorola G7 range, lost up to -74.17% of its trade-in value in 9 months in 2019, then further getting cut by -61.97% between Jan-Dec 2020.
Clearly, Apple’s iPhone segment did well to hold their won against the more populace android phones.
The report by the trade-in site also included some snippets of devices bearing noteworthy market presence.
Bout 3 – Notable device H2H’s
iPhone 11 vs. Samsung Galaxy S20 Buyback Prices (Early S21 Warning)
Comparing two heavyweights in their respective segments here also alludes to a potential warning for the Galaxy S21 model.
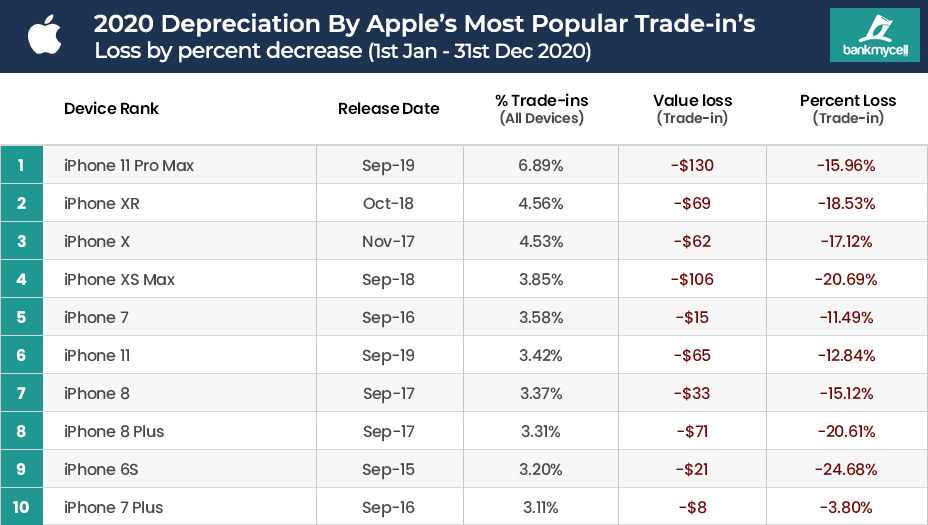
The report found that the ever voguish iPhone 11 range equated to 12.35% of all the trade-ins going through the site in 2020.
Looking at the head to head in price retention,
• iPhone 11 lost 12.84% of its trade-in value in the whole of 2020, compared with the Galaxy S20 losing a steep -34.73% in only nine months since launch.
• iPhone 11 Pro lost 21.31% of its trade-in value throughout 2020, compared with the Galaxy S20+ again losing a steady -30.59% in nine months since model launch.
• iPhone 11 Pro Max lost merely 15.96% of its trade-in value in the whole of 2020, compared with the Galaxy S20 Ultra being bled by -36.30% in only nine months since launch.
The study also came with some distinct analysis of the depreciation from these devices from launch day price, and the data uncovered was found to be shocking.
Just nine months into the Samsung Galaxy S20 Ultra release, its buyback price marked down to 64.71% less than its original retail value.
By comparison, the iPhone 11 Pro Max, from the time of its release had lost almost half less at -32.22% from its original retail value.
Further excavation in the report spells that there’s some black sheep in for Apple here too!
iPhone SE 2020 Resale Value nosedived in 8 Months
Beguiling convention, the iPhone SE 2020 did not follow the -16.70% average decline set by other iPhone models in the first year. In a surprising turn, the iPhone SE 2020 lost an average of -38.32% of its resale price within the first eight months. Looking by all variants –
• iPhone SE 2020 (64GB) sold for $399, had an initially used buyback price for $290, ended up on $175 at the end of the year (-39.66% loss).
• iPhone SE 2020 (128GB) retailed for $449, having an initially used buyback price for $350, ended the year on $220 (-37.14% loss).
• iPhone SE 2020 (256GB) went for $549 after possessing an initially used buyback price for $380. It ended the year on $235 (-37.14% loss).
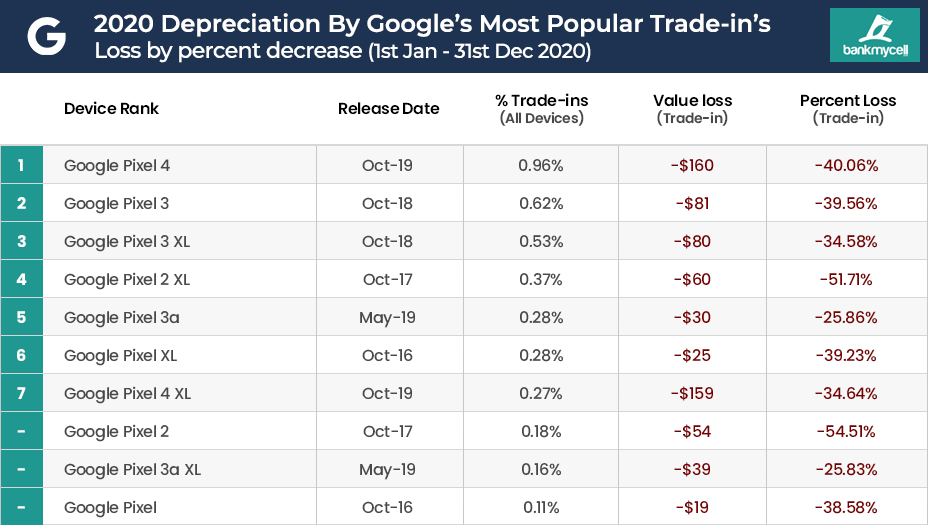
Google also featured in the report with the Pixel 4 and had to bag the highest depreciation by price or percentage by virtue of Pixel smartphones.
It was found that consumers who owned one of the top 10 most traded-in Google Pixel phones in 2020 lost an average of -40.17%(almost half!) of the device’s value in one year.
• Furthermore, in 2020, the average trade-in depreciation of all Google Pixel phones was found to be hovering around -38.46% across all models and storage sizes.
• Google’s Pixel 4 & 4 XL devices especially were at the receiving end of losing $154-$163, which is very considerable, seeing as their initial trade-in values ranged from $380 to $490 in January 2020.
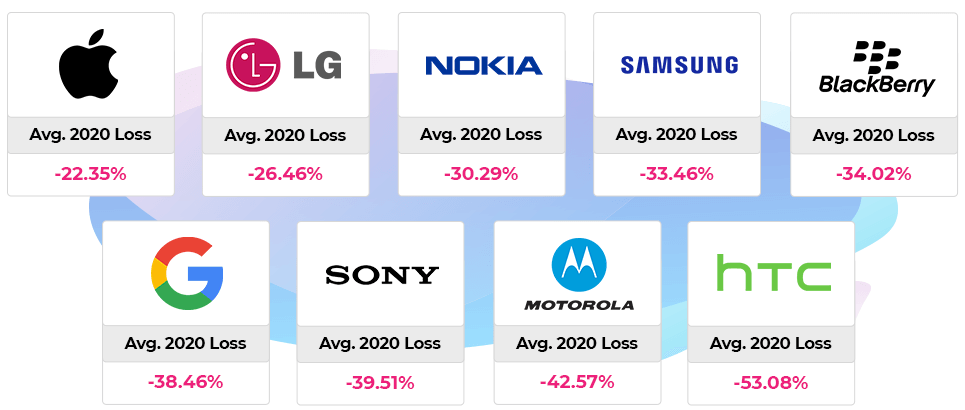
Bout 4 – Motorola, HTC & Sony: The Worst Phones for Price Retention
Lastly, users and enthusiasts have to keep in mind the phone brands that lost big in 2020.
According to the data gathered, the unfortunate top three brands whose devices lost the highest percentage were:
• #1 – HTC, whose smartphone trade-in prices depreciated a stark -53.08% on average between Jan – Dec of 2020. For the company, the HTC U11 Life (2017) was the highest, depreciating at close to -81.82%.
• #2 – The Motorola smartphone trade-in prices tumbled by -42.57% on average in the same span and Motorola G7 (2019) contributed the most, clocking losses at -61.97%.
• #3 – Sony’s smartphone trade-in prices dwindled -39.51% on average in the same year period, with Sony Xperia XA2 (2018) depreciating at a sizeable -72.22% rate.
Glancing at the picks of the report, it is enough to say that these illuminating facts and figures sorted by the keenest analysis are worth their weight in gold for those looking to peddle smartphones in the coming year. So forewarned users, remember the figures and proceed with caution on your next trade-in!
Stay tuned for more updates.
