Home Blog Page 356

Growth of Flipkart: Is Indian E-Commerce Major Slowly Running Out of Breath ?

6

The poster boy of Indian e-commerce industry – Flipkart is creating a buzz again, but this time for all the disappointing reasons. The growth of Flipkart is the talk of the town again as the accumulated loss of Flipkart is growing year over year and investors are pumping in (bound to pump in, rather) more and more money with a vision that ‘there would be light some day’. While the Bansals are enjoying the heavy pay packets as salary, a big question facing them right now is – “Has Flipkart really made it large?

The Growth Of Flipkart

In FY2013, Flipkart had shown $45 million loss in their account books on revenue of $190 million – a loss of 24% flat against revenue. The revenue soared by more than five folds in FY2012 though, the loss percentage dipped to just half compared to FY2011. One can quote it as a positive sign for the company but the calculation on FY12 losses in figures disappoints outrageously. Flipkart, which is yet to smell its first profit dollar, has been banking upon a huge sum of investments brought in by the management for the last 6 years.

The company has pocketed $550 million from various investment groups, including the largest round of funding that brought in $360 million to the company earlier this year. As per the recent valuation by MIH – an investor in the company – Flipkart is worth $1.65 billion and the company’s belief in winner-takes-all strategy could result in a 20% increase in valuation in the next one year.

Growth of Flipkart 2009 - 2013

At this stage, there are few scorching questions that may not be appraised by a few of them out there:

  • Is the recent funding round being considered as the last bet by investors on Flipkart?
  • Will Flipkart be sold (the best guess being Amazon)?
  • Will Flipkart receive a nice reception in the stock market?
  • Why can Flipkart not create Amazon’s magic in India?
  • Will Flipkart meet a similar fate as Groupon?
  • Why don’t other stores consider Flipkart as a competitor?

Let’s try and address these questions in a sequential manner:

No matter what, we must accept this, Flipkart is neither a company based upon a unique engineering model like Google nor a uniquely conceptualized platform like Facebook. Eventually, it’s a well-managed customer-focused cost-competitive online trading website. It simply buys products from manufacturers at a horribly low cost by squeezing them on numbers and sells it back to end-users with negligible profit margins, no profit margin or many times, at a loss.

Technically, it’s a well-executed clone of U.S. e-commerce giant Amazon.com, something that could be cloned again easily by any business house in India sitting on a hoard of cash and ready to burn millions in advertising dollars. The emergence of Jabong is a classic example of this. Definitely, both the sites don’t see eye-to-eye but at the core of both is the Indian e-commerce industry. After more than 6 years of existence, Flipkart is the 10th largest website in India (as per Alexa), while Jabong is not far behind at the 37th position with little less than two years of existence.

Flipkart, I believe comes a little more from the iBanker/ topi school of “let’s do spreadsheets on India vs China vs US, figure out some potential future imaginary valuation, do some funny accounting to seemingly minimize losses, throw loads of money (over Rs. 3,000 crores raised at last count) at a problem, continue to lose money forever, and hope like hell someone buys it some day, because it may never actually be a real business but who gives a damn about that anyway as long as all of us get big fat Rs. 10 crore salaries in the meanwhile”, says Mahesh Murthy, Managing Partner at SeedFund.

Like Mahesh, investors have their own view on Flipkart funding and on the possible, future rounds of investment. However, there are signals that Flipkart is finding it tough to pace up with the growth and investors are also racing against time for their money. Flipkart is reportedly eyeing an IPO in early 2015 to ensure the modest 3X returns to investors. From this calculation, the company must be valued at about $5 billion – almost three folds of the current valuation – before hitting the IPO. To achieve this, the company will have to have more sales, more employees, more vendors, more in-house inventory and undoubtedly, more funds to ensure smooth sailing, at least till the IPO. Are the current investors mentally convinced to inject another $300 million to $400 million (minimum)? Or are the Bansals already hunting for a new investor?

Experts believe it’s a kind of do-or-die situation for the in-company investors. They are left with little choice, either they can invest more and hope for a healthy exit or let the company struggle to sail to the ill-fated IPO. I won’t be surprised to see $100 million to $125 million in the sixth round of funding during mid of 2015, Unfortunately, that would be way below what is needed by Flipkart to stay afloat for the next 15 – 20 months.

 Will Flipkart Be Sold (The Best Guess Being Amazon)?

If you can count on the company’s management, then the answer is – no! Flipkart CEO, Sachin Bansal, outright rejects any possibilities of selling the company. In his latest interview to Business Line, Bansal indicated that going for an IPO is his ultimate focus. But that is his viewpoint and stand on the current situation. Global Ecommerce Sales 2013 - 2016 
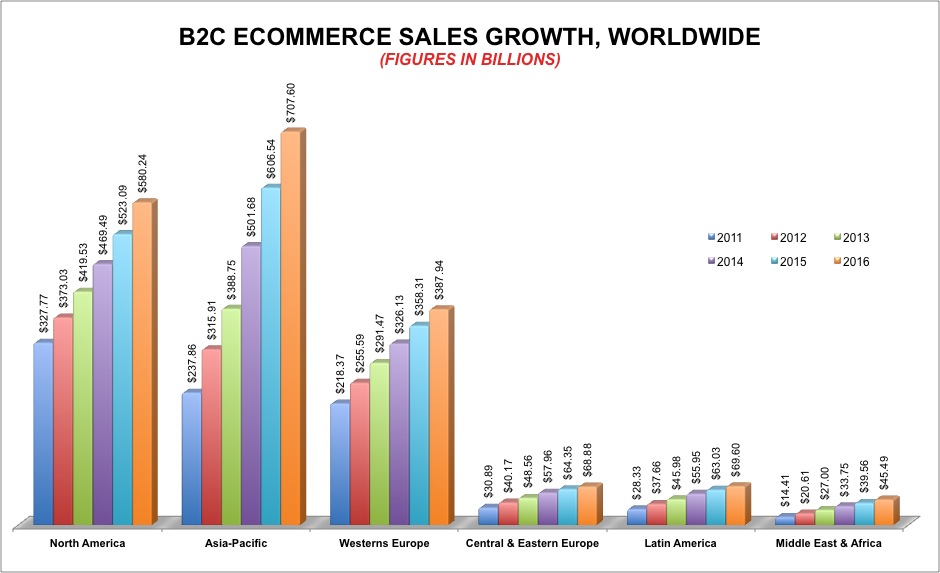
For a company, of which a majority of shares are owned by investors, such statements hold significantly less value at an individual capacity. Investors are scouting around the B2C e-commerce market in India and China, knowing the fact that Asia-Pacific will leapfrog North America to become the biggest contributor to global e-commerce sales in 2014. The B2C e-commerce sales in APAC are estimated to cross $500 billion in 2014 and grow up to $707 billion by 2016. However, considering Flipkart’s current valuation, growing losses, investors will have to pony up some big cash, with a vision to accept losses for the next 3 – 4 years.

Will Flipkart Receive A Nice Reception At The Stock Market?

Trust me, it’s a difficult question to answer. Unlike Amazon, Flipkart has not got encouraging valuation by the stock market despite losses. Besides, we must also factor the point that public investors in India are still far behind the game, where they can bet big time on an e-commerce company constantly inviting losses for customer acquisition. Another important aspect that differentiates Amazon from Flipkart is the capacity to build its own product and market that well to a level of threat to competitors.

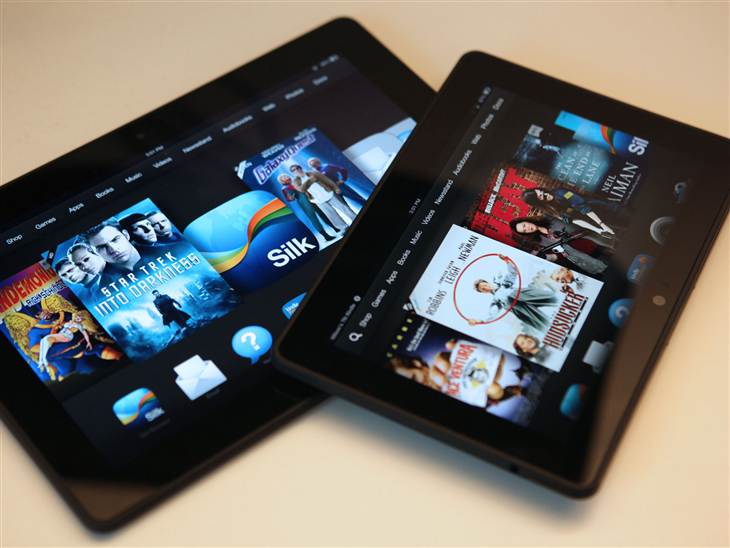
Amazon created a whole ecosystem with device, content and market in the form of Kindle. Its ecosystem enables Amazon users to buy more and more products from the site and stay loyal to the brand. With the Kindle Fire, Amazon has emerged as the only company in the U.S. that is challenging Apple on its own turf. Therefore, I see no comparison between Amazon and Flipkart and can’t provide a benefit of doubt on the basis of parallel presentation of Amazon’s well-executed-IPO-loss.

 Why Can Flipkart Not Create Amazon’s Magic In India?

The answer of this question lies with the geographical difference where people carry their own set of priorities. Like Amazon, Flipkart started with a model to sell digital books online in India. In no time, the company understood that internet users in India are not very fascinated with reading books. Consequently, Flipkart turned towards setting up the largest e-store in India for physical products.

In the process of building the ‘Amazon of India’, Flipkart, unfortunately, failed to understand that digital products inherit one-time production cost unlike physical products that invite an invest-as-you-manufacture process. This not only helps Amazon to secure a big share of each sale but also strengthen its sales channels in the form of affiliates. Today, the commission paid to affiliate marketers by Amazon is much more lucrative than Flipkart that offers peanuts to affiliates marketers after they successfully sell a Smartphone or a laptop worth $500. And this is causing Flipkart to dig a well every time it wants to drink water.

There is no way that any heavenly popular e-store could reach to each and every prospective buyer through its direct sales channels. But that doesn’t mean Flipkart doesn’t understand the value-worth of selling digital goods. Unfortunately, the company has failed to get a grip on this market time and again. The shut down of Flipkart’s digital music offering service Flyte earlier this year shows how Indian e-commerce major is far from learning the art of selling, especially at the time when similar other services – the likes of iTunes, are minting money from the respective providers.

Will Flipkart Meet A Similar Fate As Groupon?

I believe most of you know the rise and fall story of Groupon – A company that almost changed the bulk buying business and convinced SMB’s to offer fanciful discounts to each individual buyer. During its golden days, Groupon reportedly received a $5.3 billion acquisition offer from Internet giant Google, which was later turned down by Andrew Mason, Founder and then CEO of Groupon, carrying a vision towards a $15 billion IPO. The Groupon business model was tagged as Disaster by a leading research firm Forrester Research in October 2011 – at the same time when the company filed to go public. In fact, the company was accused of working like a Ponzi scheme, was losing $100 million each quarter and was using later investors’ money to pay off earlier investors.

It is important to mention that Groupon and Flipkart, both the companies are into trade business, where farther one is focused on the service industry, the later one operates for product industry. A big chunk of their revenue is collected with a liability to pay off to service providers, manufacturers or suppliers of products. The Groupon IPO was launched at $20 per share and since then the share price has kept on falling at regular intervals. Just a year after the company went public, share prices dropped 80% below Groupon’s launched IPO price. The moral of the story is that neither founder nor investors lost their money, but eventually, it’s people who are stuck with Groupon shares with an 80% loss on their investment.

Why Don’t Other Stores Consider Flipkart As A Competitor?

Remember the farewell note of Taggle.com? The company accused a few other e-stores of selling products at below cost price and burning the investors’ money to stand till the last to win the game at any cost. You may be considering this as a note from a failed entrepreneur who surrendered to competition. But it’s not a one of its kind letter and there are many other e-stores in India who strongly believe in competing with those making money, rather than the ones who are losing money to scale up their bubble presence.

The CEO of one of the leading e-stores in India quoted recently – “Your each competitor deserves your attention, time and applause if he is making even a cent profit on each dollar. Avoid bothering about those who are yet to learn how to earn!

Flipkart Is A ‘No Nonsense’ Kind Of A Company

Having said everything that I have already said, I strongly believe that Flipkart is a no nonsense kind of a company and it could scale up to become profitable by 2016 – as stated by its CEO. The company must test the brand loyalty of its customers by gradually increasing the selling price of products, up to the level of no-profit-no-loss. The results could be surprising (may carry a bit of disappointment) but will help the company to earn the confidence of its potential public investors.

The e-commerce market in India is at a nascent stage, mere 7% of total internet users in India actually make any transaction online and 85% of the population in India is yet to join the internet. This creates a big room for opportunity to grow and sustainability will be the key factor to win this game.

But I am not a sales guru and don’t want to train people on how to run their business, they know their baby better than me. So, I am concluding my thoughts with a question to all of you “Has the time come when Flipkart must flip itself ?” Write your take, comments, feedback or even criticism by making use of the comment section below. Thank you for reading!

Advertisement

Are You Late By A Minute? Here Are The Things Which Just Occurred Over The Internet In Last 60 Seconds! [REPORT]

0

The world today is moving at a faster pace than ever. In every single minute, millions of activities are occurring at a rollicking pace over the internet. The fast-growing digital and internet technology has made it possible for an all year-long process to occur within a few minutes or even seconds. More than 37.3% of world is online and is using the internet for various purposes.

Mobile broadband subscribers are expected to reach 2.1 billion by the end of 2013, which is an average annual increment rate of 30%. High speed internet is the demand of the day, 4G subscribers are expected to cross 874 million in the next few years. If you are ever late by just 1 minute and wonder what all happened in that duration – Here is an insight of One Internet Minute.

  • More than 639,800 GB of global IP data transfer takes place in every single internet minute. About 47,000 app downloads occur every single minute.
  • About 2 million search queries are sent to Google in one internet minute, about 1.3 million video views and 30 hours of video uploading takes place every 60 seconds.
  • 6 new Wikipedia articles are published every single internet minute, as well as 204 million e-mails are sent in same duration.
  • In a span of one internet minute (60 seconds), about 1,300 new mobile users are added. About 135 Botnet infections are identified and close to 20 new web users are victimized by identity theft in a single internet minute.One Internet minute

Fast-growing technology has paved the way for a vast number of processes, terabytes of data transmissions, billions of searches, millions of videos uploads and image viewing possible. People are increasingly using social media due to better internet connectivity in a majority of geographic locations. All major networking sites like Facebook Inc. (NASDAQ:FB), Twitter Inc. (NYSE:TWTR), LinkedIn Corp (NYSE:LNKD), Pinterest, Instagram and Vine have a combined user-base of close to 2 billion. All this was possible due to fast growing internet and its world-wide penetration.

  • About 277,000 Facebook logins and about 6 million Facebook views take place in one internet minute.
  • Close to 100,000 new tweets are posted on the micro-blogging sites and about 320+ new Twitter accounts are created in a single internet minute.
  • Nearly 100+ new LinkedIn accounts are created in one internet minute. Overall user-base of LinkedIn is estimated to be around 259 million and growing.
  • About 3,000 photo uploads and 20 million photo views occur on the Flickr platform in one internet minute. The total number of networked devices are equal to the global population of 7+ billion.

Source: Daily Infographic

Advertisement

70% Of Marketers Use Twitter Inc. (TWTR), Only 46% Have Invested On Twitter Ads! [INFOGRAPHIC]

1

Twitter Inc. (NYSE:TWTR) recorded an epic IPO debut due to extra hype built across its potential growth prospective in future. Marketers are somewhat acquainted with micro-blogging site’s marketing capabilities, but, very few are courageous enough to risk investing on its paid products. According to a survey of 953 executives at marketers, agencies and media companies by Ad Age and RBC capital markets, nearly 70% of respondents use Twitter as marketing channel, but, only 46% have invested on Ads on Twitter.

Marketers are still experimenting 140 char site  with lower budgets, hence it may take time to for Twitter to evolve and reach the level closer to that of Facebook Inc. (NASDAQ:FB). Hardly 3.7% of respondents reported that their ROI from Twitter marketing has drastically improved in last 6 months. About 53.9% of Twitter marketers claimed null change in their ROI from Twitter marketing in last half a year. Few other interesting findings from the survey are listed below.

  • Nearly 70.8% of respondents said that they are using Twitter for marketing (paid +unpaid) their brands. About 12.1% were likely to increase budget significantly in next one year, whereas 36.8% were planning not to risk more cash and remain stagnant in terms of monetary investment.
  • Close to 80.3% of respondents were planning to use Twitter for marketing in next 12 months, and about 51.8% agreed to spend 1-10% of their online budget on Twitter.
  • Of the 72.9% of respondents who used TV ads, 22.1% had used Twitter in conjunction with a TV ad campaign.
  • Nearly 43.9% used promoted tweets whereas 21.2% made usage of promoted accounts and 14.5% of respondents preferred Twitter amplify for marketing their brands on Twitter.
  • About 45.9% of respondents cited building brand awareness and sentiments as number one priority for using Twitter platform, whereas 20.5% claimed driving traffic to website as major criteria for using Twitter.
  • A mere 5.9% stated Twitter usage as a method to generate sales lead and 4.3% said to sell products.
  • Close to 9.9% of respondents actively updated Twitter brand page for building followers and about 8.3% were active for staying in touch with their customers. About 53% of customers on Twitter expect a response within 1hr for brand queries.
  • Twitter was born as mobile network, hence, marketers who believe on its advertising ability are bound to invest more on Twitter mobile ads. Interestingly, 72.6% of respondents claimed that Twitter mobile and desktop ads derived similar ROI.
  • Hardly 4.3% claimed that mobile ROI was higher, this signifies the need for Twitter to provide desired returns to its mobile advertisers group, as mobile users account for 75% of overall Twitter’s user base of 232 million.

Twitter Advertising Statistics

Advertisement

Facebook Inc. (FB) Dark Posts Plus Targeted Ads Can Drive Massive Engagement Rates! [REPORT]

0

The power of social media in advertising of a brand is somewhat a digestible fact for most of the marketers now, and it is considered to produce 58% more outreach than any other advertising method. Brand marketers are increasingly using platforms like Facebook Inc. (NASDAQ:FB), Twitter Inc. (NYSE:TWTR), Pinterest and YouTube, but very few of them are able to get their posts and updates right, in that sense, very few are able to gather above average success/engagement rate. For the same reason, Dark posts were introduced by Facebook,, also called as message testing which allows marketers to send out promoted posts, videos, links or images without publishing them on a brand page’s timeline.

Through Dark posts, marketers can measure engagement rate in a particular demography and decide which posts are more suited for publishing on a brand’s timeline. It helps brand by publicizing their ads in the news feed of their fan base, rather than annoying them by endless notifications of publishing posts on the brand page. Dark posts are best used if a brand firm is venturing into a new area or if they are looking to measure customer satisfaction rate amongst its existing user base.dark posts

Dark Posts In Amalgamation With Targeted Ad Options Produce More Optimized Ads (Economically And ROI Wise)!

NewsFeed is one of the most engaging parts of Facebook, and Dark Posts are the best options which can help in designing efficient ads which can not only drive better engagement but also prove to be more economical for advertisers. Imagine if Flipkart is looking to expand its services to neighboring countries like Sri Lanka or China. It can start sending out Dark Posts to Facebook users of those countries. Facebook has introduced geo-targeting by which they can target audiences based on the following criteria – location, language, gender, age, relationship status, education status, and gender. Marketers can send Dark Posts by choosing location criteria and analyze engagement rate from viewers.

Brand Marketers should focus on sending different types of posts which publicize diversified wares, apparels and products from the online store and based on the engagement rate they can decide which product launch would be optimum. In countries (like China) where local players are dominant (Alibaba.com), engagement rate would either be null or just above average – only for those products which are less available or in the region. Hence this gives a better idea of which products would be most suited to launch. When Amazon Inc. (NASDAQ:AMZN) entered sub-continent India, they started off by launching limited products and are slowly expanding to different product categories.

Dark Posts + Custom Audience Can Aid In Measuring Customer Satisfaction Rate And Promote High-Quality Fan Pages!

Facebook had recently introduced one of the most appreciated and unique features of custom audience. Usage of custom audience has increased by over 75% in the last few months as marketers looking to target audiences based on their contact details (Facebook ids, contact numbers, or email ids) are increasingly using the feature to re-target the audience base. Dark posts combined with custom audience can be best used by marketers for measuring the customer satisfaction rate.

Brand marketers generally prefer targeting their existing customer base during special promotion of products or to publicize any special holiday shopping offer or deals or if the brand is looking to convert the existing customer base into their brand app users (to keep them updated with brand stories/shop online via app). In such cases, Dark Posts must be promoted to contact addresses of fan base, if the engagement rate is positive, chances of driving further business through existing consumers is higher, else marketers must focus on fixing the issues which might have resulted in lower engagement for Dark posts or poor customer satisfaction.

Top brands who have built a significant fan base on Facebook, the last thing they would expect is – brand followers unliking the page due to overflowing published posts on the brand page, which spam their notification box. Hence, Dark Posts are important in such cases and must be used increasingly to maintain high-quality fan pages.

Excessive Usage Of Dark Posts Can Lead To Deterioration Of Brand Image!

Marketers should use split testing of different brand messages and publish the one which receives more engagement in Dark Posts test. Unpublished posts are quite helpful in message testing, but it is important for marketers to be true to their brands on Facebook. The main motto or essence of the brand must not be lost by including any meaningless or funky messages which are nowhere related to offers or upcoming promotions of new products, in the Dark Posts.

Source: HubSpot

Advertisement

Top 5 Android Tablets of 2013: Google Nexus 7 Leaves The Competition Behind [Editor’s Choice]

1
Top 5 Android Tablets 2013

It’s that time of the year again when most people will be taking a walk down memory lane as they reminisce some of the major happenings of the months that have passed by. We at Dazeinfo have been doing the same as well and as a follow-up to our previous post on the top 10 Smartphones of this year, this time we present to you – the top 5 Android tablets of 2013. We have tried to include maximum parameters, including battery backup, price, ROI, features and bundled offers while ranking these top Android tablets.

5. Sony Xperia Tablet Z

Top 5 Android Tablets 2013 Sony Xperia Tablet Z

At number 5 is Sony’s latest entrant into the Android tablet market Sony Xperia Tablet Z. This tablet has a lot of things going in its favour – Its top-notch specs, features and build tell a story.  It has also been awarded the Best Product in the Tablet category at the EISA Awards 2013-2014. The Xperia Tablet Z boasts of a 1.5 GHz Quad-Core CPU from Qualcomm and an Adreno 320 GPU supported by 2 GB of RAM. On-board memory stands at 16 GB and can be expanded all the way up to 64 GB via Micro SD Card. It’s got an 8.1 megapixel primary shooter that’s pre-loaded with a lot of creative features.

The 10.1 inch display bears a resolution of 1920×1200 pixels. The Xperia Tablet Z is sleek, powerful, feels well put together and with Sony’s extras (the water and dust resistant features, universal remote feature, etc.) thrown in, does seem like an irresistible offer. Although, it is strange to see that Sony has equipped the tablet with Android 4.2.1. However, price tagged with $429 and all the way up to $649 putting this tablet on the pricier side of things.

4. LG G Pad 8.3:

Top 5 Android Tablets 2013 LG G Pad 8.3

LG seems to have finally got its act together in the year 2013. The G2 Smartphone was a highly commendable device and its sibling, the LG G Pad 8.3 aims to be the same. The LG G Pad 8.3 sports 8.3″ FHD display and has a 1.7 GHz Quad-Core Snapdragon 600 CPU from Qualcomm that’s backed by 2 GB of RAM. Memory capacity is the usual 16 GB – expandable up to 64 GB via Micro SD card. A 5 megapixel resolution camera with BSI (Back Side Illumination) does duty as the primary shooter while a 1.3 megapixel camera serves as the secondary unit. It comes pre-loaded with Android 4.2.2 Jelly Bean.

LG released a version of the G Pad this month that comes with Android 4.4 but that’s a Google Play Edition (GPE) version of this tablet that misses out on some of LG’s own features and apps. This tablet comes with some pretty cool set of connectivity options such as Miracast, SmartShare and QPair that lets you sync your Smartphone with the device. It also has some intuitive features of the LG G2 like Knock On, Clip Tray, etc. LG’s G Pad 8.3 is an extremely well-built device, thanks to its brushed aluminium finish.

3. Samsung Galaxy Note 10.1 (2014 Edition):

note10.12014

The Samsung Galaxy Note 10.1 (2014 Edition) is perhaps Samsung’s most well-rounded device ever released. It’s equipped with almost every possible feature the Korean electronics giant could ever conceive. The 1.9 GHz Octa-Core Exynos CPU and 3 GB of RAM can easily gobble down whatever’s thrown at them. The device is also available with a 2.3 GHz Snapdragon 800 Quad-Core Processor variant. The storage capacity options range from 16 GB to 64 GB with a slot for memory expansion as well. There’s a Wi-Fi only, Wi-Fi +3G and even a 4G model on offer. It has an 8 megapixel primary camera and a 2 megapixel secondary one. This tablet was released with Android 4.3 Jelly Bean and the UI comprises of a heavily modified version of Samsung’s TouchWiz while it also runs all the native apps from Google.

It also has a number of features that are exclusive to the Note series and are meant for the S-Pen that include Action Memo, Screen Write, Pen Window, etc. Samsung claims that the Note 10.1 has an impressive battery back-up of about 11 hours. The Note 10.1 has the same faux leather finish on its back that was seen on the Galaxy Note 3. This device is designed to work in sync with the Galaxy Gear Smartwatch. This device also finds itself on the expensive side of things ($549 to $599) and that’s why it loses out on the top two places.

2. Amazon Kindle Fire HDX:

Amazon kindle fire 7 and 8.9

The latest iteration of the Amazon Kindle Fire tablets has been christened as the Kindle Fire HDX. These third generation tablets take the game forward from their predecessors in almost every possible way. Basically, there are two versions on offer – the 7 inch tablet and the 8.9 inch tablet. Both the 7” and 8.9” variants come with the same 2.2 GHz Quad-Core Snapdragon 800 processor from Qualcomm and an Adreno 330 GPU. They differ on the following counts,

  • The 7” version has a screen resolution of 1920×1200 pixels whereas the 8.9” has a resolution of 2560×1600 pixels.
  • While both device get a 1.2 megapixel front facing camera, the 8.9” version gets an additional 8 megapixel rear facing camera as well.
  • Amazon claims that the smaller 7” version has a battery back-up of around 11 hours and the larger 8.9” can last for about 12 hours on a single charge.

As far as the OS goes, Android purists might be disappointed as the Kindle Fire HDX comes with the Fire OS 3 that is a proprietary fork of the Android 4.2.2. What this means is that Amazon’s come out with its own OS that’s based on the lines of Android 4.2.2.  There’s no direct access to Google Play. However, it comes with its own set of apps and some really nice features. Mayday is one of them that truly stands out. It is an on-device technical support feature that connects you to an Amazon expert anytime, anywhere free of cost. These tablets are available in a number of configurations regarding storage capacity and connectivity options with prices ranging from $229 to almost $600 so that means, there’s a Kindle Fire HDX for everyone.

1. Google Nexus 7 (2013 Edition):

Top 5 Android Tablets 2013 Google Nexus 7 White

Google Nexus 7 tops the list of top 5 Android Tablets in 2013. Google (NASDAQ:GOOG)  seems to be gunning for glory in all segments this year. Its smartphone, the Nexus 5, iced out the competition and in the same manner the Nexus 7 tablet is decimating its competitors in this segment.

The Google Nexus 7 has been jointly developed by Google and Asus and is upgradable to the latest version of Android’s Kitkat OS (4.4.2). It’s got a 1.5 GHz Quad-Core Snapdragon S4 Pro processor, 2 GB of RAM, Adreno 320 GPU,  a 7 inch screen bearing a 1920×1200 pixel display resolution and dual cameras (1.2 megapixel front facing and  5 megapixel rear facing). Additionally, it’s got features like built-in wireless charging and SlimPort (allows HD output to an external display unit). The stereo speakers from Fraunhofer pack in quite a punch.

This Nexus can last for about 10 hours on a single charge. Prices range from $229 to $349 for different variants with regards to storage and connectivity options. Well the Nexus isn’t just about outright technical specifications. Yes, it excels in that regard, but with Google’s Nexus range of devices, it’s all about that pure Android experience and the manner in which that is delivered to you, making the device affordable and special as well.

The only sore point of the Nexus 7 is the lack of an external memory card slot, but that doesn’t take the game away from it and that’s the reason why it noses ahead of the competition and wins our Best Android Tablet of 2013 shootout. If you’re in the market for an Android tablet, the Google Nexus 7 is, by all means, the best tablet money can buy today.

We have tried our best to produce the most desirable list of top Android tablets of 2013. However, if you feel we missed anything that could beat any of the above, please don’t hesitate to make use of the comment section below.

For those who want to shuffle the above top 2 Android tablets in ranking, here is a Poll where you can rate your Top Android Tablet of 2013: [poll id=”29″]

Advertisement

Google Inc. (GOOG) Sites Topped With 14.7 Billion Online Video Content Views, Followed By AOL Inc. (AOL) With 1.3 Billion Views! [REPORT]

0

Demand for online video content is increasing at a rapid pace. Users often throng online video content properties from Google Inc. (NASDAQ:GOOG), AOL Inc. (NYSE:AOL), Facebook Inc. (NASDAQ:FB), Hulu and a lot more. Nearly 87.1% of the U.S internet audience viewed online video, with an average of 4.7 minutes per video content. People are moving away from traditional method of watching TV and subscribing for online video streaming services like Netflix Inc. (NASDAQ:NFLX) and YouTube which accounts for 50% of downstream traffic in the U.S. According to a study by a leading evaluator of digital trends, comScore Inc. (NASDAQ:SCOR), 189.2 million Americans watched 47.1 billion of online content in November 2013.

Google Owned Video Content Sites Topped With 163.5 Million Unique Viewers!

Google owned video content sites (mainly YouTube) were undoubtedly leading with more than 14.7 billion views followed by AOL with 1.3 billion video content views. The social media titan Facebook was 3rd in line with 1.2 billion video views, followed by NDN (576,699), Yahoo Inc. (NASDAQ:YHOO) Sites (343,751) and VEVO (649,705).

Top US Online Video Content Properties Ranked By Unique Views

More than 163.5 million unique viewers visited Google sites, most of it attributes to YouTube which attracts unique visitors across the globe. With over 3 billion search queries per month, YouTube is second largest search engine after Google, and contributes the most significant share of Google Sites’ unique viewers count, which accounts for 86% of overall unique viewers to all online content video sites mentioned in the table above. AOL was second in line with 73 million total unique viewers, Facebook drew about 66 million and NDN close to 51 million.

Nearly 26.8 Billion Video Ads Amounting To 10.2 Billion Minutes Were Viewed In November 2013! AOL Tops With 4 Billion Ad Impressions!

In November 2013, Americans viewed close to 26.8 billion videos ads which marks an overall ad viewing of 10.2 billion minutes. AOL was leading with over 4 billion ad impressions, followed by Google with 3.6 billion ads, LiveRail.com recorded 3.1 billion, BrightRoll Platform with 2.7 billion and SpotXchange video ad market place with 2.4 billion. Video Ads accounted for 36.2% of all videos viewed and 4.4% of all minutes spent on viewing videos online. Average duration of video ad viewed was 0.4 minutes.

The overall time spent watching video ads was 10.2 billion minutes, AOL was leading with 1.8 billion minutes, followed by LiveRail.com with 1.2 billion minutes, and far behind was by Google with 365 million minutes. SpotXchange (804 million minutes), Specific Media (882 million minutes) and TubeMogul (642 million minutes) were other prominent networks with significant video ad minutes. Hulu delivered the highest frequency of video ads to its viewers with an average of 89, AOL recorded an average of 25 and Google 32.

Top US Online Video Ad Properties Ranked By Video Ads Viewed

Online video viewing is likely to surge higher in future, as information seekers are increasingly browsing for video content on their mobile devices and desktops. On YouTube alone, more than 3 billion search queries are processed per month, and more than 4 billion hours of video viewing takes places every month. More than 800,000 TV episodes and 350,000 movies are downloaded per day from the Apple Store.

Advertisement

There Will Be 2.1 Billion Mobile Broadband Subscribers By The End Of 2013 – Seven Billion By 2018!

124

The explosive adoption of tablet and Smartphone has accelerated the growth of mobile broadband subscribers across the globe. By the end of 2013, there would be 2.1 billion mobile broadband users, which equals one-third of the total mobile subscribers. According to the latest report by Broadband Commission for Digital Development, global mobile broadband subscribers are growing at a rate of 30%, annually. The trend is expected to continue in the next few years as mobile broadband subscribers are projected to touch 7 billion subscribers by 2018.

The contribution of 4G subscribers to mobile broadband penetration is expected to stay low. By 2017, there would be 864 million mobile subscribers using 4G as the prime internet mobile network.

Mobile Broadband Penetration 2013

Mobile broadband penetration has reached an optimum level in many countries. Singapore, Japan, Finland, Republic of Korea and Sweden have more than 100 connections per capita. With 96.2 Australia is close to achieving 100 connections per capita. Local broadband service providers in these countries have played a crucial role in achieving higher penetration. As an example, Jiva offers unlimited broadband plans in Australia and similar arrangements have been done by various network providers in other countries.

“The new analysis in this year’s report shows progress in broadband availability, but we must not lose sight of those who are being left behind,” said ITU Secretary-General Dr Hamadoun I. Touré, who serves as co-Vice Chair of the Commission with UNESCO Director-General Irina Bokova.

However, other countries in Asia have presented a disappointing show. Hong Kong and New Zealand though, have achieved 73% and 65% penetration respectively, but countries like China and India lag much behind with 17% and 7% – in spite of being the largest countries by mobile subscribers.

The infrastructure growth in South Korea has been commendable. Between 2004 and 2010, the country laid down 100 Mbps broadband convergence network that helped the country to reach the highest household broadband penetration at over 97%.

By 2015, internet penetration is estimated to reach to 60% worldwide. It’s interesting to learn that now there are 70 countries, where over 50% of the population uses the internet. Interestingly, eight out of top 10 countries using the internet are from Europe.

Source: The State Of Broadband Report, 2013

Advertisement

Top 10 Creative YouTube Ads In 2013! Creativity Can Empower Paid Media! [REPORT]

0

The undisputed king of video content, Google Inc. (NASDAQ:GOOG) owned YouTube, has revolutionized the realm of video ads for publishers and viewers across the globe. Brands and YouTube users are on the site spending more than 4 billion hours of video viewing every month, followed by 72 hours of video uploading per minute, as both the activities are not charged for by YouTube. Publishers have effectively used the platform by placing creative and heart warming video ads which strike a chord with the viewer, when compared to the paid ads. According to a report by ComScore, more than 47.1 billion online content videos were viewed in November alone out of which 26.8 billion were ad views, by the Americans.

Ad Viewing Increased By 155.2% In Last 1 year! Time To Be Innovative And Crafty To Drive More Views For Video Ads!

Top YouTube Videos Of 2013

People are increasingly viewing ads on YouTube than TV or any other network. The main reason being that YouTube ads can be skipped easily if they don’t seem exciting, YouTube video ads are more creative, viral and users can also view other similar ads which might match their interests, in the side bar.  Ad views increased from 10.5 billion in 2012 to a whopping 26.8 billion in 2013, marking an increase of 155.2%. YouTube was the top viewed website for video content in November 2013 with 163.5 million unique visitors leaving behind AOL Inc. (NYSE:AOL) with 73 million viewers and Facebook Inc. (NASDAQ:FB) with 66.2 million viewers.  Advertisers are expected to invest close to $5.6 billion on YouTube for branding in 2013.

Top Ten Video Ads On YouTube Leader Board 2013!

YouTube has combined top ten video ads which were more famous in 2013 for their creativity index rather than the number of views.  Top video ads which created a great deal of buzz amongst YouTube users are listed below.

  1. Producer of Mineral water from French alps, Evian designed a very crafty video ad which amassed 68,401,464 views on YouTube. The ad was innovative and was designed by the BETC agency and directors from LA. http://www.youtube.com/watch?v=pfxB5ut-KTs
  2. Beauty care products (like skin care, body lotions and creams) producing firm Dove had launched a real beauty campaign with the hashtag  #WeAreBeautiful, a video ad which uplifted the fact that women look much more beautiful than they think. This cleverly designed video ad received a warm welcome with the total numbers of views crossing 60,946,474 mark. http://www.youtube.com/watch?v=XpaOjMXyJGk
  3. The world’s first and foremost browser in the 90s, Internet Explorer launched a campaign under the ticker name browseryoulovedtohate for redemption of the browser by launch of IE 11. http://www.youtube.com/watch?v=qkM6RJf15cg
  4. Pepsi MAX had launched an ad with Jeff Gordon, the American professional stock car racing driver which drove over 39,902,762 views and is still growing. http://www.youtube.com/watch?v=Q5mHPo2yDG8
  5. Poopourri.com, producer of scented products to drive away undesired odors had launched video ad which went viral and has recorded nearly 21,007,443 views till date. http://www.youtube.com/watch?v=ZKLnhuzh9uY
  6. Kmart.com, an American chain of discount stores, had uploaded quite a cheeky video ad on YouTube to promote its free shipping offer under the hashtag #ShipMyPants. The video ad gathered approximately 20,329,661 views. http://www.youtube.com/watch?v=I03UmJbK0lA
  7. Myxer.com which provides free ringtones, free iPhone ringtones, free wallpapers and videos had launched a video ad to promote downloading of hump day ringtones. http://www.youtube.com/watch?v=kWBhP0EQ1lA
  8. America based auto firm, Ram Trucks came up with an innovative ad to drive sales of its work trucks, total views were about 16,713,441. http://www.youtube.com/watch?v=AMpZ0TGjbWE
  9. Volkswagen publicized its Game Day TV commercial through a soothing video ad which recorded about 14,803,356. http://www.youtube.com/watch?v=9H0xPWAtaa8
  10. Audi launched a video ad named big Game commercial PROM which recorded about 10,775,251 views.   http://www.youtube.com/watch?v=ANhmS6QLd5Q

Source : Google Insights

Advertisement

Indian Tablet Market, Q3 2013 : 1.2 Million Tablets Shipped, Samsung Controls 15% Of The Market

0

Tablet market in India recorded a 9% Y-O-Y growth resulting in 1,204,410 units of tablet shipments during Q3, 2013. Nearly 20% of the shipments were triggered by the demand in enterprise tablet market. As per the recent trend, Korean electronics giant Samsung lead the growth by capturing 15% of total tablet shipments, closely followed by Lenovo with a 13.3% market share.

Being a price sensitive market, the Smartphone and tablet market in India is essentially influenced by Android powered devices. A majority of device makers, including Samsung, Lenovo and the homegrown Micromax are betting big time on the enormous exposure and adoption of Android OS. Tablet market is no exception and shipments in Q3 depict the same as the top 5 vendors, who controlled 58.7% of total tablet shipments in India in Q3, 2013, offered nothing but Android powered tablet devices to drive their sales.

Tablet Market India Q3 2013

It’s the first time that Lenovo has made the list of top 3 tablet vendors in India and is the only vendor offering Windows 8 powered tablets also, among the top five vendors. However, Android devices are driving a majority of Lenovo’s tablet sales and Windows 8 is yet to claim any sizable share.

“It is becoming interesting to watch this space as the market grows and matures. Like the consumer segment, Android OS-based Tablets dominate the India Enterprise Tablet PC space as well. But with more vendors committing to Windows OS-based Tablets, the interest levels amongst customers are showing increasing trend. In a couple of quarters we expect Windows OS-based Tablets gaining significant traction within the India Enterprise segment”, said Faisal Kawoosa, Lead Analyst, CMR Telecoms Practice.

During Q3 2013, the demand for tablets in India, under the enterprise segment had a high penetration rate due to multiple industry verticals. However, retail, BFSI and pharmaceuticals are expected to drive the growth from the front.

The demand for tablets is poised to grow and we could see a different distribution of market share altogether after Q4, 2013. Recently introduced to the Indian market, Apple iPad Air and Windows 8.1 OS powered tablets are expected to eat up Android’s share. Earlier we projected how Android powered 87% of all tablets sold in India during 2013, followed by iOS (iPad) with 10% of tablet market share in India while Windows powered tablets secured a mere 3% of the Indian tablet market. Small screen tablets (7-inch to 8-inch) are estimated to hold the biggest pie of tablet market and mid range income users seem more interested in tablets.

There won’t be much of a shuffle in the vendors’ position though, but buy-back offers and holiday season in India could portray a new picture for the tablet market in India. The distinctive lead will help Android remain at the top but with lost market share to iOS and Windows OS 8.1.

Source: CMR India Q3, 2013

Advertisement

Twitter Inc. (TWTR) Users Are 3X More Likely To Follow Brands Than Facebook Users! 81% Of Brands Fear Social Media Presence Due To Possible Misuse! [INFOGRAPHIC]

2

San Francisco based Twitter Inc. (NYSE:TWTR) which was born as a messaging service and later evolved into a world-class micro-blogging platform, has seen an incredible growth and now provides companies and brands, a platform for addressing the masses with a mere 140 char tweet, gather wider brand recognition and publicity through its exciting features. Marketers of various firms are increasingly adopting the Twitter platform due to its viral nature and wider outreach due to features like re-tweets, mentions and hashtags. Brand accounts must be monitored wisely and continuously to notify all the pertaining activities, talks and discussions about the brand amongst its followers.

Although, social media usage can also harm a brand’s image if not used prudently, but it is an unavoidable part as a majority of customers prefer engaging with brands on social media, they often share and discuss about brands with their friends, followers, family and relatives on social media platforms. Hence brand presence is important on all major social media platforms.

According to an Infographic by Twilert, which analyzed Twitter for brand engagement by users, summarized data points and stats emphasizing on the vitality of Twitter in brand marketing. A few more interesting findings are listed below.
  •  Close to 57% of companies use Twitter for businesses and generate 2X more leads per month than those who avoid using the platform.
  • Twitter users are 3X more likely to follow brands than Facebook brands, as Twitter folks are more hungry for exciting news and information in the form of short tweets, whereas on Facebook, a significant share of users are involved in various tasks apart from news consumption
  • Nearly 33% of active Twitter users share opinions about brands, companies and products and close to 32% of active users recommend brands, companies and products to others
  • About 33% of active Twitter users ask for recommendations about products and companies and 19% expect customer support from companies via the Twitter platform. Nearly 53% of customers expect a response within an hour on twitter.
  • Close to 67% of customers are more likely to buy products from brands they follow, 79% of Twitter users are bound to recommend the brands they follow to their tweeps.
  • Although, social media is an unavoidable part for companies and brands, nearly 81% of them fear using any of the networking sites as they can harm the company’s reputation if not used properly.
  • Only 23% of companies are using social media monitoring tools. It is vital for all brands and companies to adopt the latest social media technologies as it is the place where customers are. Fearing brand damage due to improper usage of social media tools and avoiding its usage can prove costly for brand marketers.
  • Twitter usage is inevitable, as it is required to keep a note of certain things like –
  1. who is talking about your brands, who talks and who influences the talkers? What are Twitter users saying about you? Do They share opinions and experiences?
  2. When do these conversations happen? Are they Event Driven?
  3. Why are conversations happening? Are they positive or negative, questions or complaints?
infographic twitter
Advertisement

Facebook Inc. (FB) In 2013 : Most Talked About Personalities, Exuberant Revenue Growth, Mobile User-Base – All In A Nutshell! [STUDY]

0

The social media titan, Facebook Inc. (NASDAQ:FB) has paced itself very well in 2013, especially when it came to fast changing demands of its users, advertisers, increasing challenges in mobile space and tough competition from rival networking sites. It has evolved a number of features in the last 12 months to tackle the problems ahead and provide an experience they can cherish, for its users & brands. More than 1.189 billion users have actively shared their memories, life time events and celebrated the historic events together with their friends, close peers and family members on the world’s largest social networking site.

Facebook In A Nutshell In 2013

  • Most Talked About Topics Across The Globe: Top trends or personalities spoken about on Facebook in 2013 in order of their magnitude were – Pope Francis, Election, Royal Baby, Typhoon, Margaret Thatcher, Harlem Shake, Miley Cyrus, Boston Marathon, Tour de France and Nelson Mandela.

most talked about topics in 2013

  • Most Talked About Topics In India In 2013: Number one spot in most talked about topics on Facebook in India went to BJP’s Prime Ministerial candidate for 2014 Lok Sabha elections – Narendra Modi, next in line was Cricketer Sachin Tendulkar, the iPhone 5s, newly elected RBI chief Raghuram Rajan and India’s historic Mars orbiter space mission Mangalyaan also made it to the list.most talked about topics in India in 2013
  • Most Talked About Topics On Facebook In The U.S In 2013: List was topped by Super Bowl, followed by Government Shutdown, Boston Marathon, Syria Crisis and Harlem Shake. Pope Francis, George Zimmerman, Royal Baby, Nelson Mandela, and Presidential Inauguration were other topics which dominated Facebook gossip in 2013.most talked about topics in the U.S in 2013
  • Most Talked About Topics In The U.K In 2013: Tennis star Andy Murray gained top spot followed by Margaret Thatcher, UEFA champions league final, Prince George, Sir Alex Ferguson, Call of Duty Ghosts and England retain Ashes in Cricket. X-Factor, The Bedroom Tax and Grand Theft Auto 5 were the other most talked about topics on Facebook in the U.K.most talked about topics in the U.K in 2013
  • Top 10 Life Events: Amongst the most shared milestones on Facebook, few notable ones, in order of their magnitude of sharing were – added a relationship, got engaged or got married attained top spot, Traveled was 2nd most shared event, followed by Ended a relationship, First met a friend, added a family member or expected/had a baby, Got a pet, Lost a loved one.

top fb life events

  • Top 10 Check-Ins Across The Globe: Disney Land of Anaheim gained number one spot amongst top check-in spots across the globe, followed by The O2 of London, Parque Ibirapuera of Sao Paulo, Golden Temple of Amritsar, Tokyo Disney land and Melbourne Cricket Ground of Australia.

top fb checkins around the world

  • Facebook Revenue Traced A Glorious Path Breaking All Past Records:
  1. The social media titan released its Q1 report on March 31, 2013 recording revenue figures of $1.46 billion, up by 38% from Q1, 2012. This figure just went higher in Q2 attaining 1.8 billion mark and crossed historic 2 billion in Q3, 2013 which marked an increment by a whopping 60% compared to $1.26 billion in Q3, 2012.
  2. Facebook’s revenue share from its newly undiscovered infant mobile product (Facebook Mobile) surged from 23% to 30% in Q1 of 2013. The Facebook mobile powering technology further advanced to promote kick-ass branding for advertisers on miniature devices resulting in mobile revenue share further soaring up to 41% of total revenue in Q2 and 49% in Q3, 2013.facebook-exploding-revenue
  • Facebook Monthly Active Users Growth Increased At A Decent Pace: Facebook rolled out numerous features throughout the year to improve browsing experience for users. It’s MAUs in Q1, 2013 was around 1.11 billion, up by 23% Y-O-Y basis. In quarter 2 of 2013, MAUs increased to 1.15 billion, and in Q3 figure rested at 1.189 billion, an increment by 17.2% compared to the same quarter a year ago.facebook desktop to facebook mobile
  • Facebook Mobile User Base Grew Beyond Expectations: Extensive usage of Smartphone and tablets led to an increase in the user-base of Facebook via mobile. In Q1, 2013 nearly 751 million Facebook users were active on a monthly basis on mobile, followed by 819 million in Q2, 2013 and 874 million in Q3, 2013. This figure is expected to soar higher with Smartphone and tablet market growing further.
  • Browsing Features Innovated For Users In  2013:
  1. Facebook unveiled a significant amount of changes to make the browsing experience for users more better and attractive. Facebook recently revamped its Like and Share button to make them more attractive, hoping to increase engagement by users who view them more than 22 billion times a day across 7.5 million websites
  2. Facebook revamped its news feed algorithm to provide more relevant news to users based on their browsing activities. Updates from media publishers’ websites are promoted higher due to an increasing demand for news pertaining to latest trends.
  3. Facebook, listed as top Smartphone app with an average of 103,420,00 unique users, stole Twitter Inc. (NYSE:TWTR)’s most precious discovery tool Hashtag and introduced them on Facebook, although it hasn’t proven to be much successful, but is expected to perform well if users utilize it wisely.
  4. Facebook revised its news feed design to provide better browsing experience to users and help them in personalizing their content streams. facebook browsing
  5. To compete with messenger apps and help users overcome traditional methods of paying per SMS to message friends and close peers, it revised its messenger app by which users can message faster and at an economical price.
  6. Thumbnail images were made wider and bigger thereby saving users’ efforts of clicking the image and traversing to different browsing page for a magnified view.
  7. Edit feature was introduced by which users can change the text, image, link or any content of the post anytime after the post is up. This helped users in correcting their statements if written wrongly earlier, also, in case of controversial updates, changes can be made to avoid other users protesting against it and reporting the posted status.
  8. Link Share Preview were made available in full size using which users can know exactly what they have shared. Sometimes users get confused with different links and might end up posting the wrong one, in such cases, the preview feature helps the users by posting the link details below the post before updating it on Facebook.
  • Revolution In Advertising Arena By Facebook – Inside Story!
  1. Facebook innovated vividly to provide brand advertisers with unique and more specific advertising opportunities to drive better sales and ROI. The most notable one being the Custom audience feature by which brands can target their existing customer base for new consumers, provided they have their email ids or phone numbers or Facebook ids. This is vital for marketers who are looking to re-target their consumers or have a consumer base within a limited coverage area.
  2. Facebook improved page insights to provide detailed and apt descriptions for success report of advertisement campaigns. Indigestible metrics like People Talking About was replaced by Page Likes, People engaged (likes, shares or comments), page tags and page check-ins.
  3. Cookie based ad-targeting was introduced on its ad buying platform called FBX, to help advertisers re-target the users who might have once visited brand websites and remind them to engage or make a purchase from a brand site by placing ads on the side bar of their home page.
  4. Facebook launched Review option for its pages related to places and outlets, this feature is likely to rolled out for all brands in the near future. It will help brand marketers when users placed reviews in the form of star ratings and comments. It will help them in improving the page outlook, updates and other details by analyzing users’ feedback.facebook ads mroe specific
  5. To assist NGOs, it recently launched Donate now button for posts and pages of NGOs, this feature enables donations via a pop-up window. Earlier, users were forced to navigate to a different page for making online payments. This feature is likely to ease payment procedure and encourage people to donate more.
  6. Facebook was playing around with the launch of auto-play video ads in a flip-flop manner. Initially sources had reported about the launch of auto-play video ads in mobile apps, they later backed out claiming concerns over users’ browsing experience, and have again recently confirmed the re-launch of the auto-play video ads.
  7. Location and gender based ad-targeting was introduced to assist brands whose products are specific for consumers of a particular gender or a certain geographic location. This helps them by reaching the potential audience and increase conversion rates
  8. Embedded posts, a social plugin that lets you easily add public posts from Facebook to the personal blog or website, was introduced. This has made the platform even more engaging as brand websites can let let users like, share, and comment to join the contest straight from their websites.

Source: Facebook

Advertisement

How Brands Can Leverage On Twitter Inc. (TWTR) To Increase User Engagement Activity By 324% On The Micro-Blogging Site! [INFOGRAHIC]

0

The micro-blogging specialist, Twitter Inc. (NYSE:TWTR) had a terrific IPO debut, due to extensive buzz surrounding its potential growth in future. Twitter, due its outstanding adaptability to the mobile space and its unique features in terms of tweet, re-tweet can prove to be a potential marketing weapon for brand marketers. Its viral nature can help brands in publicizing their brands to the masses easily. Marketers must focus on studying all possible tricks and tactics of effectively using the micro-blogging site and drive more user engagement to increase sales.

An Infographic by Quicksprout.com has unveiled vital statistics and data points pertaining to the micro-blogging site’s potential in driving user engagement with Twitter brands. Few important points are listed below.

  • The micro-blogging site with over 135,000 sign-ups per day has been embraced as a marketing platform by over 75% of businesses.
  • Twitter with over 190,000,000 website visitors per month, has more than 33% of its users following at least one brand.
  • Active tweeting users post more than 58 million tweets per day and about 79% of the active user-base recommends brands they follow.
  • The San Francisco based Twitter, hosts more than 36 million unique visitors per month and records close to 5700 tweets per second.
  • Close to 50% of shoppers made a purchase based on recommendations found through social network, 67% of Twitter users are more likely to buy from the brands they follow.
  • Saturday and Sunday are the best possible occasions to post tweets as the Re-tweet rate is 0.168 on weekends, highest compared to the rest of the days.
  • Twitter recently rolled out visual tweets. Images and video links will now be visible within the tweet itself. This has increased the engagement rate by over 200% for tweets with image links.
  • Brand marketers must focus on Tweeting questions as 21% people are more likely to respond to a tweeted question.
  • The Re-tweet rate can be as high as 86% for tweets containing links, hence it is vital for marketers to include a link which elaborates the tweeted message in a detailed manner for those who wish to seek more information about the topic.
  • The Re-tweet rate is 4X higher for Tweets which requests followers to RT or re-tweet than the ones which do not ask for a RT.
  • Offering a brand follower with special promotional deal increases likelihood of driving a sale or purchase by 349%.
  • 61% of Twitter brand followers are eager to provide feedback and offer ideas. Hence, it is vital to engage actively with all the tweeps at the earliest. About 74% of followers look for updates related to future products.                                                                                                                                                            Twitter Engagement Increase
Advertisement

Social Referral Traffic Up By 110% Whereas Organic Search Traffic Ceases By 6%! [STUDY]

0

Driving robust traffic to a brand’s website is one of the prime objectives of any ad campaigns or promotional event run by marketers on various networks, if consumers or fan followers visit brand websites after viewing the ads and engage in some form, half the success is achieved. Website traffic can come via social media referrals, organic search, direct traffic or paid search and a whole lot more. According to a study by Shareaholic, which analyzed data collected over the last 13 months across 200,000+ sites that reach more than 250 million unique monthly users across top 5 search engines, Google Inc. (NASDAQ:GOOG), Yahoo Inc. (NASDAQ:YHOO), Ask, AOL and Bing and major social media networking sites like Facebook Inc. (NASDAQ:FB), Pinterest, Twitter Inc. (NYSE:TWTR), StumbleUpon and Reddit, reported a whopping 110% increase in social referral traffic rate in the last 13 months.

Web Users Providing References To Search Engines Dip Their Organic Search Rate By 5.87%!

A couple of years ago, when social media was at infancy stage, marketers preferred investing on SEO marketing to get higher ranks on search engines. But the trend is reversing as social media industry is booming and is expected to soar higher in years to come driving extensive referral traffic to brand websites. Website traffic distribution

If we analyze the table above, the share of organic search traffic is fluctuating between 39% – 43% in the last 13 months. Overall average share of organic search traffic is around 41.45% which marks a dip by 5.87% in last one year. Shareaholic further predicted that a handful of search engines are likely to see sudden growth in their personal market shares compared to the growth in the overall market share. The main reason attributed to the above statement is – web users usually reference search engines when they need any information.

People are increasingly consuming news related to latest trends, politics, brands, job hiring and a lot more on various social media networks and by mutual discussions with their friends and relatives. Hence, they are well acquainted with various brand names and whenever they are looking to buy some product or search for some information, they directly type out the website URL (direct traffic) or provide reference to the Google search engine with the brand name or any close-by keyword. If a person is looking for a particular book and needs it pretty urgently at an optimized cost, he would type out Flipkart, Amazon or Snapdeal and browse for the desired product in the online store website rather than searching for the top e-commerce site in India, fastest delivering online store or online store selling books at best prices.

Brand marketers should increasingly adopt multiple channels/platforms and embrace the latest marketing technology by practicing them periodically to maintain brand recognition and establish a steady foothold in the market. Followers are bound to arrive at the website from various undiscovered or lesser known networking channels or platforms, hence it is important to maintain presence in every single channel possible. SEO is an important factor as well, as a significant amount of web users still prefer knowing about any particular brand through organic search.

Social Media Referral Traffic Rate, Up By 110% In The Last One Year!

The social media industry is booming in terms of driving referral traffic to brand websites, the social media titan Facebook accounts for more than 10% of referral traffic rate to websites and is spiking up by 170% year over year. B2c firms acquire more than 77% of their customers through Facebook. The world’s largest professional networking website, LinkedIn drives close to 64% of referral traffic to corporate websites and B2B firms. Pinterest has taken the e-commerce section by surprise accounting for over 10% of visits.

In the graph below, we can observe that social referral traffic rate spiked up by 110.95% in the last 13 months and is expected to soar higher in years to come. Pinterest recently introduced the holiday gift guide and holiday gifts feed to help shoppers with suggestions for gifts amidst the hottest shopping holiday season. Related pins also guided Pinterest users to follow more topics which are close enough match to their interest topics. Facebook revamped its like and share button to provide better browsing experience, custom audience feature was initiated for better targeting of ads to a relevant audience, news feed revamp has materialized as people were browsing for the latest news on social media sites (Website traffic through Facebook for media publishing sites increased by 170% in the last 1 year). The above described measures have lead to an explosive referral traffic to websites through social media websites.

search-traffic-vs-social-referrals-graph-Dec-2013

The Perceivable Conclusion For Marketers!

Social media is the daily go to marketing option and brand presence on all the major networking sites is inevitable for the marketing team of brand firms. Brand marketers must actively involve and update their brand accounts on various social media sites. A major portion of investment must be focused towards social media marketing as it has 58% more outreach than any other network. Social media networks drive potential customers to brand websites, hence marketers must scale up their social media activity and must actively post questions, informative blogs, news and engage with their followers.

Advertisement

Trending Consumer Trends : Smartphones Changing The Way People Use Technology [Study]

0

Smartphones are changing the way we talk, the way we decide our food, the way we enjoy ourselves and above all, the way we spend our money. Smartphones are not only changing the way we live our lives but also the way the world does its business.

Apps Rule The World

Smartphone apps are used today for day to day activities. In modern context, Smartphone apps are used by people to decided how to commute, what and where to eat, what to watch and what to shop. Apart from these leisurely activities modern Smartphone users use apps for their banking and utility needs. App are also being used by the users to vent their dissatisfaction with both private and public sectors.

Predicted Availibility of Mobile Services

A study was conducted by Ericsson in Sao Paulo, Beijing, New York, London and Tokyo to evaluate possible future services concepts in city life. Users predicted around 25% increase in availability of services within a year and a further 25% increase in 3 years. This increase is predicted across all levels of services in city life like shopping, restaurants, leisure facilities, children/elderly care, communication with authorities and traffic.

Body Is The New Password

biometrics_survey

When in September Apple introduced the fingerprint scanning technology on its iPhone 5S , it was met with a lot of skepticism. But now consumers have started embracing it for its convenience. In a recent survey conducted by Ericsson around 61% of consumers told that they were ready to use fingerprints to unlock their Smartphones. While around 52% were ready to use fingerprints to replace all internet passwords and 50% were even ready to use fingerprints for online credit card purchases. About 48% consumers were ready to use retina recognition to unlock their Smartphones.

The survey showed that the modern consumer is comfortable with using their bio-metrics to get rid of long complex passwords for their different subscriptions. Use of bio-metrics also helps them to get rid of the problem of remembering different passwords and also provides them relief from passwords getting hacked. The bio-metrics capability of Smartphones could be harvested by banks to provide its consumers with more secure service. Use of bio-metrics could harness the next big revolution in the telecommunication industry.

Smarthealth

health-hand

Smartphones have unleashed an era where people can keep track of their health and wealth. Smartphones have proved to be a boon for health fanatics who want to stay abreast about information pertaining to their health. These tracking apps provide people with multiple benefits, they can keep all their health related data at one place and analyse them if they want to compare them with their friends over social networking sites.

health survey

In a recent survey carried out by Ericsson, around 40% of the consumers it contacted wanted their Smartphones to log their daily physical activities, while 56% wanted a ring to monitor their blood pressure and pulse, another 59% wanted a wristband to monitor their sleep and walking habits.

The Fifth Element

internet-4-necessities

Internet has become the fifth element for many of us. Lack of proper bandwidth over telecommunication signals has been the most cited complaint of mobile users. Wi-Fi connections in public places have started making appearances, but finding them is not very easy. Most of the Smartphone users use their phones for high bandwidth usage like watching videos and playing games while commuting and a lack of quality internet signal is the cause of frustration for most of them.

intenet-survey

The latest study shows that only 39% of consumers in emerging nations are content with the internet speed while commuting, while only 29% nations among industrialized nations are satisfied with the internet speed.

Social Watch

video-watching
Social Media plays a big part in what we watch over on internet, be it YouTube videos, movies or TV series. People are generally influenced by what their friends watch and share on social media like Facebook and Twitter. Most of the recent hits on YouTube became hits only after they started trending on Facebook and Twitter. Social media websites have now started dictating what to read, listen and what to watch.

Play-Pause-Play

pause_play_stop

Devices in our homes and offices have started talking to each other. It has become a daily routine for people to start watching something on their TV, pause it and then again start watching the same series right from where they had paused on their Smartphones, while commuting. Devices have integrated seamlessly with each other and with our lives. TV today talks to the tablet, tablet to Smartphones and Smartphones to the laptop.

Survey-1024x483

This Pause and play facility offered by major streaming services have changed watching TV or movies from being time consuming entertainment activities to 10 minutes refreshing activities.

Source: Consumer Trends 2014

Advertisement