Home Blog Page 320

Microsoft Windows Phone 8.1 OS Now Powers 24.4% Of Windows Phones: Nokia 520 Is The Most Popular Windows Phone !

1

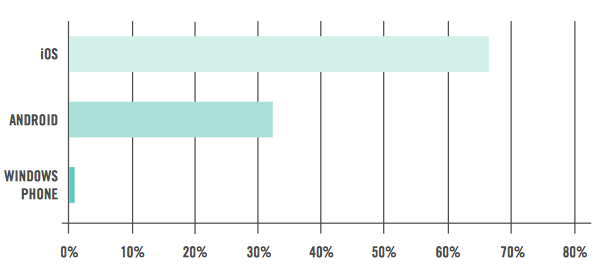
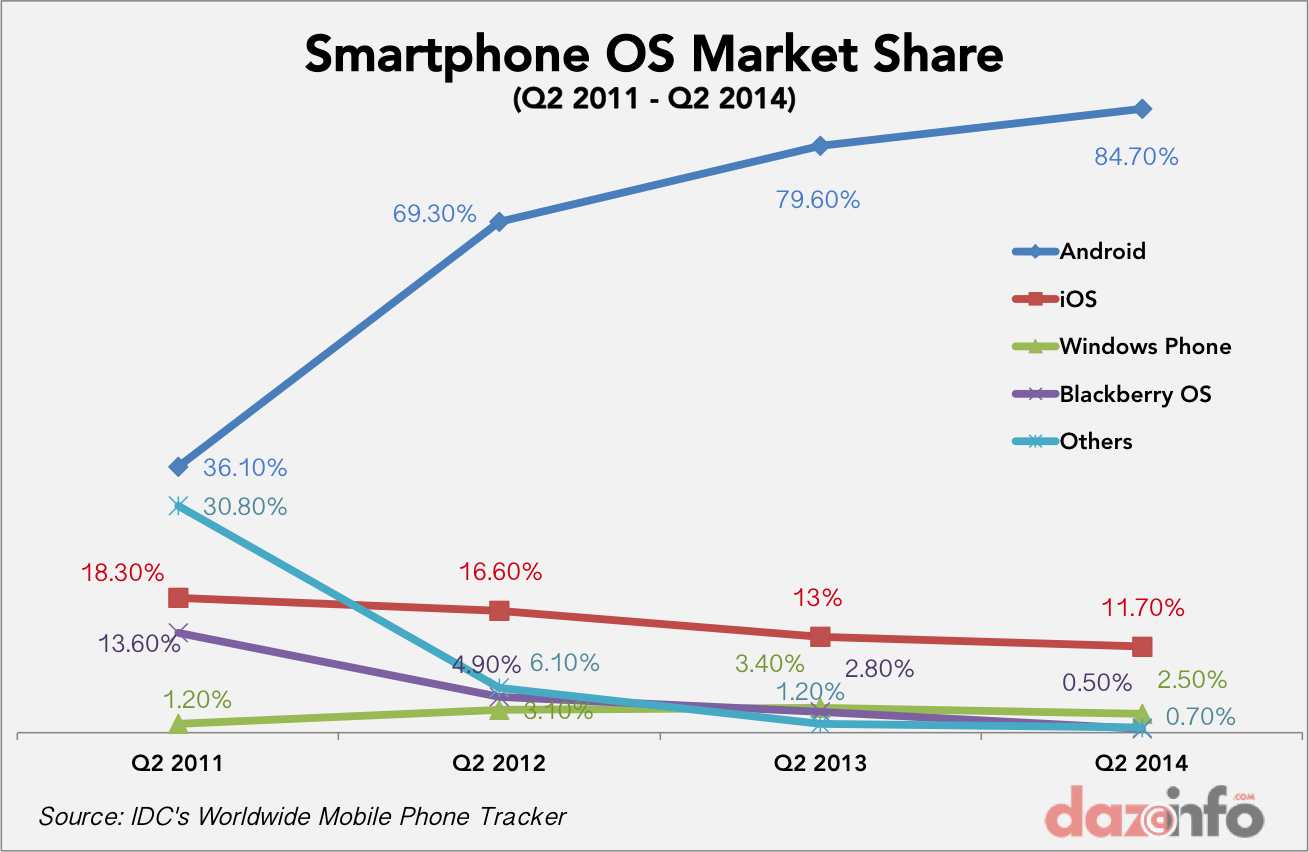
Microsoft Corporation (NASDAQ:MSFT) is leaving no stone unturned in it effort to rapidly promote its Windows Phone OS. Although the global market share of Windows Phone still languishes at just 2.5%, the Windows Phone 8.1 OS is showing promising signs of growth. Several large and small OEM vendors, including HTC Corp (TPE:2498), Micromax and Prestigo, have recently launched few smartphone powered by Windows Phone 8.1 OS. According to Adduplex Windows phone statistics for August 2014, the Windows Phone 8.1 OS is now present on 24.4% of Windows Phone devices, which is an 12.5% increase from July 2014.  AdDuplex based the report on data collected from 4,496 Windows Phone apps running AdDuplex SDK v.2.adduplex-windows-phone-device-statistics-for-august-2014-5-638

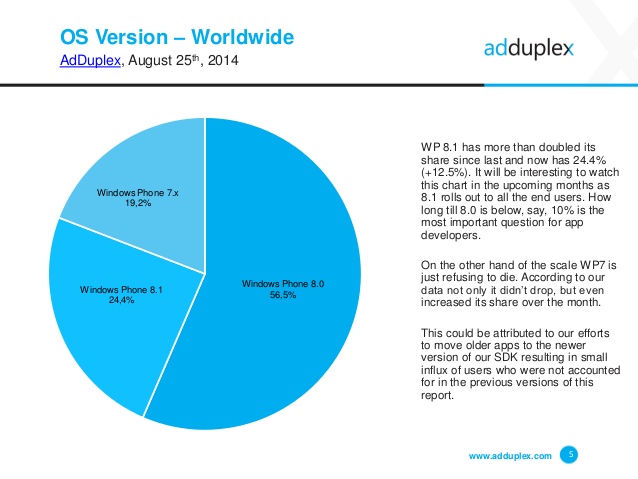
Microsoft Hopes To Make Strong Inroads With WP 8.1

The global roll-out of Windows Phone 8.1 OS began during August 2014, at the same time several devices such as the HTC One M8 for Windows Phone and several Lumia models such as Lumia 530 and Lumia 630 were available in several markets worldwide. While Windows Phone 8.1 OS now powers almost a quarter of all Windows Phone devices, it was running on 3.1% of all WP devices by April 17th 2014 – just three days after the developer version was released. This is surprisingly quick, if we consider that the adoption rate of the latest Android 4.4 Kitikat was just 5.3% even six months after its release.

Nokia Corporation (ADR) (NYSE:NOK) which was acquired by Microsoft in 2013, is still the largest Windows Phone OEM, and now constitutes 95% of the Windows Phone market. The entry-level Nokia Lumia 520 is the best-selling Windows Phone globally with a 30.2% market share. Other OEM vendors however, have failed to gain much traction with the Windows 8.1 Phone OS. Chinese smartphone vendor Huawei Technology Co Ltd (SHE:002502) has even abandoned  further development of Windows phones, citing low demand as the cause.

US And European Market Dominated By Low-End Devices

In the US the most popular devices are the Nokia Lumia 520 and the Lumia 521. The surprise entrant in the list is the Lumia 630 device powered By Windows Phone 8.1 OS, which jumped from the tenth place to fourth place in just a month. The Windows Phone OS market share is still just 3.4% as of July 2014, filling the void left by Symbian and Blackberry OS. Microsoft is likely to face extremely stiff competition from Apple and other Android OEM’s during the second half of 2014, especially after the launch of iOS 8 and Android One smartphones.adduplex-windows-phone-device-statistics-for-august-2014-8-638

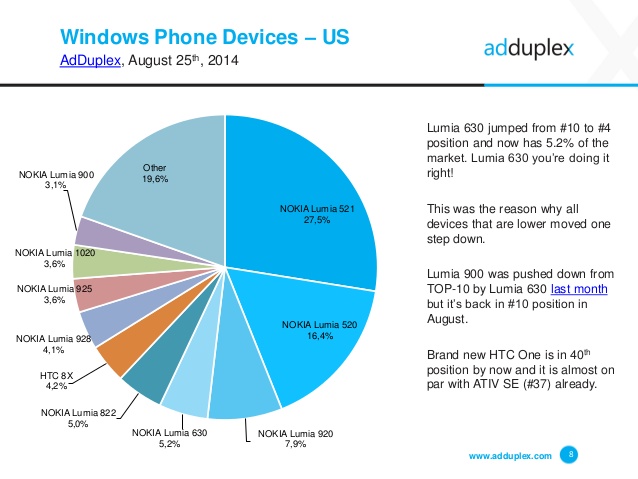
Windows Phone devices are extremely popular in some European markets such as the UK and Italy, the market share of Windows Phone OS in the U.K for July 2014 stood at 9.9%.  Here again the Lumia 520 has a market share of 34.8%, while the Lumia 625 occupies second place with 9.8%.adduplex-windows-phone-device-statistics-for-august-2014-10-638

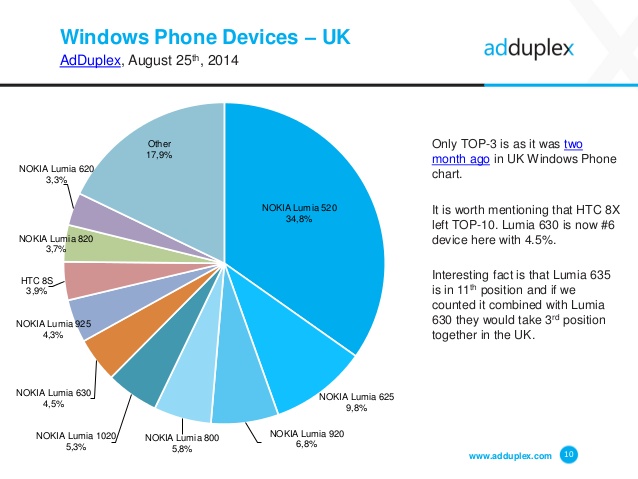
Phablet Phones Are More Popular Internationally

The statistics also show some interesting trends internationally. In Egypt it is surprising to note that the Nokia Lumia phablet 1320 device occupies 5th place with a market share of 5.8%, while the Lumia 1520 occupies 9th place with a 2.1% market share. The scenario is no different in China as well, where the Lumia 1520, which is the largest Lumia phablet till date, has a market share of 5.3%, while the Lumia 1020 enjoys a market share of 4.3%. A budget phablet device, powered by windows Phone 8.1 OS would do well to boost the bottom line of Windows Phone in these emerging markets.adduplex-windows-phone-device-statistics-for-august-2014-18-638

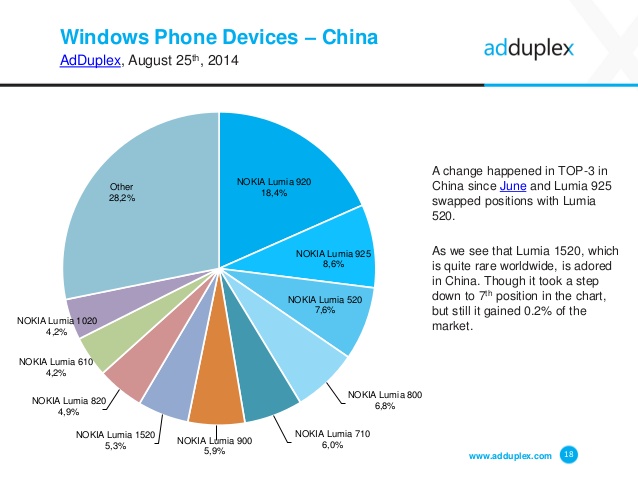
Can Windows Phone OS Beat Competition From Android?

The statistics show clearly that the Nokia Lumia 520 is undoubtedly the most popular Windows Phone smartphone in the world. The device sales performance convinced Microsoft to introduce Windows Phone to a global audience, and the Redmond giant hopes to meet similar success with its successor, the low-cost Lumia 530 powered by Windows Phone 8.1 OS. However the low-end smartphone market has become increasingly far more competitive due to the launch of Android One, which is likely to be a game-changer in emerging countries.

Microsoft’s other option to attract more users is to offer the promise of a better ecosystem than Android. It is widely expected that Microsoft will unveil a new version of Windows named Windows 9 on September 30th 2014. Speculation is rife that the new OS will combine the smartphone, tablet and laptop experience to  merge into one single ‘Windows’ ecosystem. This will undoubtedly in turn, attract more users towards Windows phone.

Advertisement

Apple Inc. (AAPL) iPhone 6 Battery Performance Not So Encouraging: Comparison !

3

Few days back we revealed how Apple Inc. (NASDAQ:AAPL) has made iPhone 6 more repairable than its predecessors, and also disclosed inbuilt 1 GB RAM with iPhone 6, something that Tim Cook didn’t disclose during the event. Today, in a new teardown report, we have brought the comparative battery performance of iPhone 6 and iPhone 6 Plus which is a serious matter of concern especially with the large screen smartphones. Unfortunately, the results are not so encouraging.

Apple iPhone 6 is ranked at 9th position in the list of best battery performer smartphones. The iPhone 6 sports a 1,810 mAh battery, which is capable of giving 5 hours and 22 minutes of talk time. When compared to iPhone 5S, this is 300 mAh higher, but once you put this figure parallel to some of the best Android smartphones within same price range, its lags much behind. Sony Xperia Z3 and Huawei ASCEND MATE7 and arch-rival Samsung galaxy S5 scores over both iPhone 5 and iPhone 5S in battery segment. Both Sony Xperia Z3 and ASCEND MATE7 are capable of providing more than 9 hours of talk-time – nearly 80% longer battery life than iPhone 6.

Apple iPhone 6 battery performance comparison

However, the battery performance must not be judged from the sole point of view of mAh numbers. With the new enhanced iOS 8 OS and latest A8 Processor size of the battery may not matter the most. But, this could only be judged after a detail user review of iPhone 6.

When it comes to iPhone 6 Plus, the findings are somewhat satisfactory as there is a significant difference in the battery power of both the iPhones. In 5.5-inch iPhone 6 Plus, Apple has provided a 2,915 mAh battery which easily leapfrogs LG G3 and Samsung Galaxy Note 3, but still fails to match HTC One M8, Galaxy S5 and top performers Xperia Z3 and Mate 7. However, it’s also notable that all the top five devices, except iPhone 6 Plus, sports a relatively smaller 5-inch or 5.2-inch display.

For some of prospective iPhone 6 buyers these figures look discouraging, but it is important to mention that each one of us uses smartphone differently. A person relying heavily on text message may find the same battery performance better than other iPhone 6 owners who uses the device for frequent long duration calls or heavy consumer of video or games.

Apple has just started shipping the iPhone 6 and iPhone 6 Plus. Therefore, it’s advisable that we should adopt the strategy of wait and watch and let the best of reviewers should come with their say about the performance of battery, screen, RAM and processor. Eventually, it’s not about numbers written on the components and parts, it’s all about performance.

Advertisement

Google Inc. (GOOGL) Backed HTC Nexus 9 Tablet Coming Soon !

0

Google Inc. (NASDAQ:GOOGL) has once again proved that it’s actively working to bring all Android OEMs on a level playing field. According to the latest information from WSJ, Google has signed HTC Corp (TPE:2498) for its next 9-inch Nexus tablet, purported as HTC Nexus 9. HTC is not known as one of the best performers in the tablet segment though, but its commendable jobs with smartphones apparently convinced Google to look no beyond. HTC’s flagship One series smartphones may have not scored big in terms of shipments, but it has received glowing response from the market with a number of reviewers naming it as the best smartphone in the last two years successively.

Both Google and HTC declined to comment anything on the reported development.

HTC-Nexus-9-Tablet-Concept

After the disappointment with Flyer tablet in 2011, HTC refrained from introducing any new tablet. However, backed by Google, the Taiwanese company is looking to re-enter into the tablet market with a bang. The selection of HTC may look so convincing, especially when few other Android OEMs have done a commendable job in the space. But the move could be well attributed to the fact that Google is trying to pull Android out of the Samsung’s shadow and doesn’t want a single company create monopoly with Android. Last year Google picked ASUS over other tablet OEMs to introduce Nexus 7 tablet, while in the smartphone space LG manufactured Nexus 4 and Nexus 5.

One of the other convincing reasons to ditch Samsung – the maker of Nexus 10 tablet – could be the growing influence of Samsung over Android. Be it smartphone or tablet the Korean electronics giants have taken a distinctive lead over other OEMs by flooding the market with a number of devices, suitable for all classes and masses. One out of our every Android tablets shipped in Q2, 2014 was manufactured by Samsung. In the first half of 2014, Samsung shipped 19.7 million units of Android tablets as compared to 4.8 million units by ASUS and 4.5 million units by Lenovo – the other two top players in tablet industry. Apple topped the list with nearly 30 million units shipments of iPad during the same period.

worldwide top tablet vendors 2014

In partnership with HTC, Google is trying to develop a new market segment of mid-size tablet with 9-inch screens. Both, HTC and Google are trying to penetrate the growing tablet (2-in-1) market, estimated to register a yearly growth of 19.2% in 2014. In 2014, Android tablet shipments are estimated to reach 158 million units to 239 million units in 2018. While the small sized tablets, screen sized between 7-inch and 8-inch, would control more than half of the tablet market in 2014, the market share of tablets with more than 8-inch screen size is expected to swell to 48.90% by 2018. This projects a great opportunity for the big screen tablet. However, considering, users are yet to have an experience of 9-inch screen tablet device – Apple iPad Mini has 7.99-inch screen – HTC and Google may be expecting an encouraging response from the market with their Nexus 9 tablet.

More than Google, the success of Nexus 9 is important for HTC, which is going through rough patches in the smartphone market. Though, the company already has experience on working Nexus line with Google – Nexus One in 2010 – HTC failed to leverage on the partnership and didn’t produce any more Nexus lineup device since then. The growing competition in the smartphone market has made HTC to look further new avenues and the company’s executives have promised to introduce new products, probably smartwatch or smart band, in the near future.

With so many challenges and competition ahead, it’s difficult to predict the sales number of Google-HTC Nexus 9 tablet, but HTC could definitely learn something from ASUS, who partnered with Google for Nexus tablet and profit soared to double digit, led by the sales of Nexus 7 tablet. For And, for Samsung its just another disappointment, probably.

Advertisement

Apple Inc. (AAPL) Surprises Analysts WIth The Popularity Of iPhone 6, 6 Plus And iOS 8 !

6

With pre order sales of iPhone 6 and iPhone 6 Plus reaching 4 million within first 24 hours, analysts at Wall Street have shown optimism about the newly launched, next generation handsets of Apple Inc. (NASDAQ:AAPL).Moreover, Fiksu iPhone 6 launch comparison and iOS 8 launch comparison show that number of active devices since its launch is in the favour of predictions by market enthusiasts. It is already being compared with the sales of Apple’s iPhone 5s and iPhone 5c units which were reportedly around 9 million in their launch weekend. Previously in 2012, Apple sold 5 million record units of iPhone 5 in its launch weekend setting a new record at that time. With price as high as $999, almost comparable to 128 GB MacBook Air, the pricing strategy of Apple has been always surprising.

Apple iPhone model price

Still the enthusiasm among Apple consumers with the launch of every new product is not only sustained, but is found on the higher side. Despite of its high price, the Apple consumers have been increasing ever since, leaving market researchers stunned.

The demand of Apple products will continue to rise

Analysts believe that if the adequate supply is maintained, it wouldn’t be surprising if the Apple’s new product demand reaches 10 million this time. As per a projection by analyst Rob Cihra of Evercore Partners, shipment of iPhones will reach a total of 37 million in the September quarter, a year over year increase of 10 percent. BMO Capital Markets’ Keith Bachman sees this around 35 million, but expects that his estimation may see a higher figure as time passes. These estimated figures are quite close to the our projection that says Apple will close the quarter with record 60 – 70 million iPhone sales.

Gauging the iPhone 6 and iPhone 6 Plus Adoption

It has been just 72 hours since the launch but the % of active users of iPhone 6 has reached 1.24% (see graph). It has outpaced the iPhone 5s in second place at 0.5% from last year at the same point in time post launch. At third position is iPhone 5 with 0.3% followed by iPhone 6 Plus at 0.24%. iPhone 6 and iPhone 6 Plus has a total of 1.48 % of all iPhones in comparison to the 5c and 5s at 0.66% at the same point last year. It shows adopton relative to prior iPhone launches.

Screenshot (7)

After 100 hours since the launch of iOS 8, the adoption rate of the iOS version is comparatively slower than the earlier version of os iOS, shows Fiksu stats. While iOS 8 usage reached to 24.76% after the said period, its predecessor iOS 7 and iOS 6 were running on 42.7% and 38% of iPhone. However, this difference is supposed to become slim as more and more people will start using iPhone 6 and iPhone 6 Plus.

iOS adoption rate after 100 hours launch

What makes Apple’s strategy different?

Despite its soaring prices, Apple is seen to have a very loyal fan base. In the US it is growing at the cost of Android in Smartphone segment.

Top-Smartphone-Vendors-in-US-July-2014

It has been more because of it is catering to high end users than the developing economies. Apple Inc. (AAPL) iPhone contribute more than 50% in company’s Q3 2014 revenue, as reported by its fiscal Q2 2014 earnings. When late back in the year, iPhone 5c needed to be sold in both subsidized and unsubsidized market, it made the pricing tricky. It was then receiving a subsidy of $450 on the iPhone. Since the carriers have no reason to lower the service bills of iPhone 6, it seemed ridiculous for Apple to lower the subsidy – proposed $0 with contract. The pricing strategy can be analyzed here itself; Though, this will not make much of a difference in the overall cost of iPhone but from the viewpoint of both marketing and profit, $0 contract will affect the brand of Apple. With the heavy advertising that goes around, $0 will mean an incredible number of iPhone units out in the market. This will eventually be linked to the expectation of consumers around $0 and Apple will be associated as “cheap”. Apple will never take any step that affects its brand. It is widely accepted that it is the brand of Apple that sells. Particularly, in Asia, the brand prestige of iPhone is the biggest selling point. The user experience and apps have turned out to be secondary. Apple, rather any other company, would have willingly stuck to this pricing strategy if it is worth the profit.

apple-iphone-price-subsidy

Enterprises have become Apple’s hot target

Besides the unsubsidized market and price sensitive customers in the subsidized market, Apple has made it a point to target the enterprises. With Android fragmentation and the RIM implosion around, Apple has been continuously trying to become a viable default option for the enterprises. Infact, Apple iOS beats Android with 2X margin in enterprise device activation in Q2 2014, iPhone reportedly accounts for 51 percent of activated devices, while iPad accounted for 90 percent of tablets.

Good.iOS.Q3.2014

Good.iOS.Q3.2014.1

Apple products are not only about features

Apple products from iPhones to iPads and Macbooks are well-known for their features and quality. With the new iOS 8 and data encryption, its dominance in the field of Smartphone is unquestionable. It is, however, to be reminded time and again that it is not only the features, but the well thought strategy designed by the company that makes it the most profitable despite the high prices.

Advertisement

How Alibaba (BABA) IPO Posing A Serious Threat To Key Ecommerce Players Amazon And eBay !

0

The ringing of the morning bell of NYSE on 19th September by Aibaba Group Holding Ltd. (NYSE:BABA), the Chinese e-commerce giant marked the launch of biggest Initial Public Offering (IPO) in US history. The company raised $21.8 billion on the first day of its trade increasing its market capital value to $231 billion and putting it among the top 20 biggest companies by market cap in the US. Alibaba far beat out its tech peers like Facebook Inc. (NASDAQ:FB) whose first day earning was $16 billion and Google Inc. (NASDAQ:GOOGL) whose 2004 IPO launch just raised $1.67 billion.

In a nut shell Alibaba is an eBay, Amazon.com, Amazon Web Services, PayPal, and many more rolled into one.

alibaba-ipo-jack-ma

The Alibaba Group

Alibaba Holding Group Limited is a Hangzhou based group of e-commerce which is comprised of various business entities. Its consumer-to-consumer portal Taobao featuring nearly a billion products and is one of the most visited website all over the world. Alibaba.com Limited is the principle company of this Group which is the largest business-to-business trading platform for small enterprises globally. Alibaba.com, initiated in eastern china has three main tasks, the main English subsidiary deals in the imports and exports between more than 240 countries of the world and various parts. The second platform of this consortium 1688.com deals in domestic  B2B trade in china. Conjointly,  Alibaba.com harbors a transaction based retail website named Aliexpress.com which promotes  smaller enterprises to buy limited quantities of goods in at the manufacturer’s rate. Also, Alipay.com is a third party online money transaction platform of this group without any transaction fees. In the present scenario Alipay has become the largest market player in China with 300 million users, processed $623 billion of digital payment in fiscal 2014 and controls little less than 50% of china’s online monetary payments. It’s some other affiliations include Alibaba cloud computing Aliyun, China Yahoo and the recently launched US shopping site 11 Main.

Alibaba Jck Ma Worth

The group was launched in 1999 by Jack Ma and in just a span of 15 years has surpassed the e-commerce market leaders Amazon and eBay whose present net worth are $153.08 billion and $60 billion respectively. Alibaba presently controls nearly 80% of Chinese e-commerce market, but Ma seeks to expand its realms crossing the borders of this dragon land. Last week in Hong Kong during his global tour he commented-

“Speaking for Alibaba, we hope to become a global company, so after we go public in the US, we will expand strongly in Europe and America.At the same time we won’t abandon Asia, because after all we’re not a company from China, we are an Internet company that happens to be in China.”

Although Alibaba is being compared with other e-commerce sites like Amazon and eBay in terms of its selling services and advertisements, but in terms of their business model they are not exactly direct competitors. Alibaba basically works on the lines to make it easy for the customers to buy almost anything from manufactures in China online and that too directly. On Alibaba one can buy anything he or she has dreamt of- right from a used 747 airplane, ethnic jewelry to a pack of 1000 pins.

Ringing of Morning Bell by Alibaba Sounds Like A Warning Bell for Amazon, eBay, Facebook

The excitement of Alibaba’s IPO among the US traders can be illustrated by the fact that many investors were not able to buy this stock on the first day of trading. About half of the shares were pawned to 25 investment firms, The Wall Street Journal noted.

The growing popularity of Alibaba in such quick succession has posed a serious threat to Amazon. The US e-commerce giant was founded in 1994 and in 2014 ranks 9th in the index of most visited websites whereas Alibaba came into the picture five years later in 1999 but has been able to capture the 10th position in the same list. Although Amazon in the year 2013 earned ten times more revenue than Alibaba with $74.95 billion to $7.95 billion, but the fourth quarter growth of 2013 for Amazon ended with a margin of 0.94% while Alibaba accumulated close to 50% margin in this tenure of three months.

The investors at the moment are bullish for this mega IPO launch, but the passing of time would test its real grabbing power. However, the marketers are having various opinions for the launch of this Chinese e-commerce giant but the stumbling of stocks of both the tech market leaders Facebook and Twitter on the launch day of this historic IPO that a new czar has dawned in the technology market of the world.

alibaba vs ebay 2012 2014

Amazon is also a far more bigger threat for eBay. The farther one is growing much faster as it sells 4Xas much stuffs in dollars. Both of online retail giants are in the business of marketplace but Alibaba is growing 50% annually in volume terms and 30% of its sales are being driven by the mobile commerce, allowing it to take the distinctive lead on eBay.

Alibaba is desperate to expand outside China due to the fact that homegrown vendors have started posing a possible future threat. Though, these startups are controlling almost negligible market share in the country as compared to Alibaba, but the numbers of such startups are growing and each startups are scoring as well. Social Media and online gaiming firm Tancent, mobile messaging app WeChat and second biggest e-commerce company JD.com is closing the gap with Alibaba. Therefore, Alibaba has written several big checks to make strategic investments outside China to play at global ground where opportunities are endless.

To get a glimpse of the journey of Alibaba from a small business model to the key player of e-commerce, check out this video.

Advertisement

Google Inc. (GOOGL) Takes Data Security To A New Level With Android L OS !

0

In an attempt to heighten the security features in the Android OS, Google Inc. (NASDAQ:GOOGL) is reportedly offering data encryption in its upcoming Android platform – Android L, by default. Simply put, only someone with decryption keys can decrypt the available data which may include photos, text and other media communication. With encryption enabled out of box, it will give a tough time to law-enforcement to access data on the smartphones even with a legally binding valid warrant. Until and unless the user’s pass code is available, no one will be able to access any private data. It has been hailed as a positive feature amongst the general mass; however, it has raised eyebrows in the security agencies who may object due to security concerns.

Weak security measures of Android were long under scrutiny

Dating back to devices prior Android 4.4 which were found vulnerable to Adobe System web-view privilege escalation, malwares have been known to impersonate various trusted Android apps and potentially hijack your phone. The Bluebox Security research team, Bluebox Labs, recently discovered a new vulnerability in Android. It allows these identities to be duplicated and can be used for wrong motives. Researchers at Columbia University School of Engineering and Applied Science have recently discovered a crucial security problem in Google Play – the official Android app store.

3-3

With their tool PlayDrone they were able to extract secret keys, including that of Facebook and LinkedIn. With their security measures under question, Google was looking to answer them with complete protection.

Kept optional for 3 years, it’s now automatic

Though Google has been providing data encryption capability since past three years, it had been kept optional. Google’s spokesperson Niki Christoff told media that keys/passcodes are not stored online or anywhere off your device, so Google has no way to share them. It is, however, widely accepted that majority of the users were unaware of this option. Hence, now users don’t even have to bother about turning it on, with default settings in place.

3-1

Google’s reportedly attempt to boost data privacy behind the ramparts of upcoming Android L is seen as an attempt to come at par with its rival Apple Inc. (NASDAQ:AAPL), who has recently announced data encryption feature with the newly launched iPhone 6. Market is anyhow elated with the decision of these two software giants who seem to have accepted the need to protect the security of data, applications, the device and data on a wider scale.

Data privacy may turn out to be a one way advantage

It is definitely not a completely win-win since this new feature has come with its own drawbacks. Too much dependability on the passcode implies that once you lose the passcode, OEM too will be helpless in retrieving the data. Security agencies’ concerns can’t be overlooked with apprehensions that anti-society elements may find this new feature quiet favorable. Even when confiscated, the legal authorities will find themselves making shots in blank air. On a personal level, none of the changes made can be undone once encryption is done. The only solution that will remain will be restoration of all the factory settings which eventually will clear all alterations that were made initially. Battery drain is another problem which still needs to be resolved. Processing speed and storage too is bound to be affected along with computational resources.

The user base may increase with this new technology shift

3-2

Androids smartphone market share is already around 84% with 255.3 million Android powered smartphones being shipped in Q2 2014, resulting in a 33% yearly growth. With the new Android L, this user bases my see a gradual increase due to the enhanced security feature. Apple, though shares a better market profit, its user base still lags behind Android more because it is known to cater high-end smartphone users having deep pockets. This is unlike Android which finds its majority of users in the developing countries in the Middle East, South East Asia etc.                                           

Updating older versions will remain a tough task

Though both iOS 8 and Android latest “L- release” have tightened their security measures, Android still lags on the front to reach to its existing users. The user base of Apple is already known to be quite loyal when compared to Android. This may take several months before most of the Android based smartphones have this fully-encrypted feature updated on their phone. This is reasonable since Android is a mobile platform that was designed to be truly open. Manufacture worldwide use this platform with their devices being sold by a whole range of different cellular carriers. For so many available versions of Android, even years old, to be updated with this feature will bring Google nightmares if it wants all its versions to come at pace with this new technology. This problem, known among experts as fragmentation, has been discussed previously. This is unlike Apple which has control over both its hardware and software. When users will update their iPhones or iPads, including the old ones, the new iOS 8, they can automatically avail this facility of full encryption. It hence seems that Android has to wait before it can actually claim that its new security feature has reached all its users.

Advertisement

Worldwide Social Media Ad Spendings 2014 – 2016: Asia Pacific Region Clings Almost 30%

1

The Asia-Pacific region has proved to be a promising region for the social networkers for expanding their domains of enterprise and attracting the endorsers to expand business with them. Although North America still leads the segment with 42.3% share of worldwide social media spending worldwide in 2014 but the APAC region has captured the second spot in this index in the latest forecast report on Worldwide  Social Network Ad Spendings By Region 2013 – 2016, overtaking Western Europe. In 2014, the Asia Pacific region accounted for 29.2% market share, a year-over-year growth of 0.6%, in social network ad spending worldwide whereas the Western European region just held 22.4% of the stake for the same.

Worldwide Social Network Ad Spending share 2013 - 2016

The ad spending expenditure of APAC region

The Asia Pacific region accounts for 54.7% of the total global population and 47.5% of the worldwide Internet users, but in contrast to the number of Internet users, it harbors 52.2% of total social media users and this large chunk of social media users from the APAC region has scorched the analysts for deducing a growth of 53% in social network ad spending this year as compared to 2013. The total expenditure of the social networks on the ad campaigns in this region is expected to exceed the $5 billion dollar mark this year and it would account for 12.2% of digital ad spending, which is higher than its share in UK.

China Qzone at the moment is the king of social media network in the APAC region having 645 million users followed by Sina Weibo with 503 million registered users but Facebook Inc. (NASDAQ:FBthis year outpaced all other social platforms in terms of Y-O-Y growth (10.2%) accounting for 410 million active users in July 2014.The dominating countries in the Asia Pacific region have been China and Japan in terms of social network economies because in both these nations people follow a brand on social media site in large numbers as compared to the US. The region’s share in terms of ad spending is expected to rise by 2% in the next year as this much decline in the same sector is forecasted in the North American continent.


The greatest contributors of online search and browsing in the world have been the developing nations like China, Brazil, India and Japan, but the Asia Pacific region supersedes the Latin American region (both of these constitute the majority of developing nations) in terms of buying stuffs online with almost 14 out of 22 product categories under consideration exceeding the buying rates to the browsing rates. Hence the marketers are anticipated to spend 3 out of 10 dollars on social media advertisement in this APAC region as 36.5% of worldwide B2C e-commerce is expected to be accumulated from this region in 2014.

The major Internet giants like Facebook, Google and Twitter are competing to increase their revenue from mobile ads and with the APAC region catering 47.6% of global mobile users, this part of the world is expected to be the most preferred avenue for expansion in the mobile ad revolution. By 2018 eMarketer has forecasted that mobile ad spending would account for more than 50% of all online media, which in turn will account for about one-third of total ad spending.

Spending per user in APAC region yet to revive

While the expansion of social media ad disbursement has been significant in the APAC region, the spending per user is still on the staggering zone. This is due to the fact that most of the developing nations of this region like India and Indonesia have immature digital advertising economies. The mobile ad industry is also facing a huge disparity in the Asian markets because the mobile ad expenditure as a percentage of digital media spending will approach 70% in the U.S. in 2018, in China it will be about 30%, which will be directly proportional to the slower growth of social media ad spending as in the Asia Pacific region about 52% of online shoppers prefer mobile for purchasing.

Even after the prevalence of so many gloomy trends in the segment of social media ad spending in the APAC region, the marketers of this sector are still bullish on its growth in this region and the survey of eMarketer has predicted that at the end of their forecast period, 16.1% of digital dollars in the Asia Pacific region would go towards social network which is approximately $8.6 billion.

Advertisement

Apple iPhone 6 And iPhone 6 Plus More Repairable Than Predecessor !

0

The iPhone 6 and iPhone 6 Plus are officially out in the market to grab starting from today and as usual people are going crazy to grab the successors of iPhone 5S. However, one of the biggest challenges for iPhone owners remains the repair of iPhone in case of any damage. We all know that getting the iPhone repaired is not only a costly affair, but also a complicated job due to the complex structure and expensive components lie under the hood.

iPhone 6 repairability

As the iPhone 6 is already out, it’s time for folks at iFixit to peep inside the iPhone 6 and iPhone 6 Plus to understand the manufacturing complexity and expose the commendable job done by Apple engineers. And, the verdict is finally out; both Apple iPhone 6 and iPhone 6 Plus are designed in a manner that provides a greater level of flexibility and repairability for users. The screen of iPhone 6 and iPhone 6 is easy to remove and replace, as it has been prone to break in the past. The battery is much more straightforward accessible and exposed and could be replaced without much of efforts now. Apple has also rearranged the fingerprint wires towards the upside as it used to be the biggest obstacle and porn to damage while opening the device during the repair.

iFixit has given seven points to iPhone 6 and iPhone 6 Plus on the scale of one to 10 in terms of repairability.

But iFixit also tried to explore more about the components installed inside the Apple iPhone 6 and iPhone 6 Plus. It reveals the much discussed secret of RAM and found that iPhone 6 Plus sports 1 GB of RAM while, they failed to find it out in iPhone 6. However, its being presumes that considering the chipset and many other similar components, iPhone 6 too carries 1 GB of RAM inside the hood, but iFixit is not certain about it. This is a bit disappointing as the smartphone industry has moved above 2 GB of RAM inside smartphones and most of the smartphones of iPhone price range sport 3 GB of RAM. Anyways, the other identified components from Qualcomm, Broadcom, SanDisk (NAND flash), NXP (motion co-processor), SkyWorks and a few other manufacturers were almost the same in both the iPhones.

While we found that iPhone 6 is more repairable, an interesting incident took place meanwhile in Perth Australia. A guy named Jack, who happened to be the first person to buy iPhone 6 in the country, unintentionally and unknowingly did a drop-test of iPhone 6 within few minutes of buying right outside of the Apple Store. After grabbing iPhone 6, jack tried to open the tight packed iPhone 6 box in front of a camera, and then something strange happened that left people there stoned for a moment. Here is the complete video of Jack and his iPhone 6 unboxing:

Advertisement

Facebook Inc. (FB) Attracts 10% Of Digital Ad Spends From Just 6% Of Digital Time Spent In US

0

The social platforms are turning out to be the most preferred avenue for promulgation by the marketers in today’s time. For Facebook Inc. (NASDAQ:FB) second quarter of 2014 proved to be the clear illustration to this upsurging trend as the company’s total ad revenue shot up to $2.9 billion which was 61% more than the previous quarter. Adding to these growth figures, its mobile advertisement profit expanded by 151% in this quarter representing 62% of overall advertising revenue in company’s total earnings of this three-month tenure. Facebook even overshadowed its prime competitor Google Inc. (NASDAQ:GOOGL) in this Q2 and emerged as the king of digital advertising.

Along with the growth in revenues, Zuckerberg’s inception is also clinging on very strongly to its network in 2014; it is estimated by eMarketer that US adults spend an average of 21 minutes each day on Facebook.  This has been the first ever analysis made by this social media research and analysis firm of daily time spent on the social network. This span of 21 minutes caters for one-third of the time US adults spend every day on various social networks, 6% of time they spend with digital devices and 2.8% of their time is consumed on all media. Furthermore, the study deduced that the average time spent per day with all leading media among the US adults will escalate by 21 minutes from 2013, summing up to 12 hours 28 minutes in 2014.

Average Time spent per day with facebook by US Adults

The contrast of ad revenues generated to average daily time spent on Facebook

The stats pointed out that nearly 6% of digital media time of US adults is spent on Facebook but on an average 10% of US digital ad spendings are attracted to this platform which presents a sharp distinction to all other social networks presently active on the web.

The year 2014 is expected to be involving almost half of the major media time on digital devices which is approximated to be 5 hours 46 minutes, but in contrast to the time spent on these devices only 30.5% of digital media spendings will go in the pocket of these digital channels.

The panoramas of the various activities of digital segment are cogitated for more time spending on them in comparison to their ad spendings in 2014. The video sector is approximated to utilize 15.9% of the adults’ digital time in comparison to 11.7% of advertisers’ spending on them. Similarly, the online radio programming is expected to snag 11.2% of the total time of US individuals spend on digital devices whilst capturing 4% share of digital advertising. These comparative figures for Facebook are totally contradictory with other social networks as they are anticipated to consume 11.9% of US adults’ digital time but only perk 3.9% of digital revenues.

average time spend vs ad spending in US 2014

The report also highlighted an interesting fact about time spent by the US adult citizens on Pandora, a personalized radio that plays the music preferred by the individuals. It aggregated that in the present year the US adult population will engage 7.1% of their daily time listening to this modern radio and it is highly astonishing that this span of time is greater than the average time spent by these folks on Facebook. But in spite of such large listener base, only a fraction of digital ad spendings that is about 1.4% is predicted to be earmarked for this music store.

digital media actvities vs digital spending in US 2014

 The factors contributing to strong position of Facebook in the advertising sector

While the users on various modes can employ several modes to ignore and skip the ads like skipping the ad sections on digital videos or omit the ad campaigns on Pandora, but on Facebook it seems a difficult task to overlook the ad content because they are interspersed. Also for Facebook, the ads that appear on its photo-sharing platform Instagram have also proved to be a promising mode of generating revenue which the company had initiated last November. Adding to this, the introduction of third party mobile apps, premium video advertising and focusing on the demands and capabilities of the audience to buy from their advertisement space has really paced Facebook too ahead of its competitors in the advertising segment, which can be embellished by the trend that 84% of young shoppers are influenced by Facebook for choosing a brand!

Advertisement

Apple Inc. (AAPL) iOS App Store Revenue From Games Grew 70% Y-O-Y; Mobile Devices Killing Gaming Device Market!

0

As Apple Inc. (NASDAQ:AAPL) didn’t launch any new product or service in the second quarter of the 2014, Google Inc. (NASDAQ:GOOGL) owned Android OS continues to be  adopted at a blistering pace globally, and its combined share of the smartphone and tablet installed user base hit 70% in the same quarter. The rise of smartphones and tablet devices is pushing  new frontiers in the mobile gaming segment, with record revenues being spent on purchasing best selling gaming apps such as Candy Crush Saga and Clash  of Clans.

app annie 1
The rise of handheld mobile gaming has caused optimized gaming handset shipment sales of Nintendo Co. Ltd (ADR) (OTCMKTS:NTDOY) and Sony Corp (ADR) (NYSE:SNE) to decline precariously, according to App Annie’s portable gaming spotlight report for Q2 2014. With more high end mobile devices set to be released during the last two quarters of 2014, gaming will continue to remain a huge money-spinner for both Apple App store and the Google play.

Android Now Present on 2.1 Billion Devices Worldwide

Android’s smartphone market share now stands at 85%, while its tablet market share is almost 70%. Android’s rise comes at the expense of Apple iOS which saw its user base fall by 1.9% between Q2 2013 and Q2 2014. Other platforms such as Blackberry, Symbian and Windows also saw a rapid decline by 6.4% in the past year. With games accessible to an ever-expanding pool of users, it’s no surprise how important games are to the Google Play store, constituting 40% of all downloads and generating almost 85% of app store consumer spending. During the past one year alone, Google Play revenue from games more than doubled. app annie 2

The trends suggest that the increase in mobile gaming spending is being driven by new users and not the existing ones. This is particularly true in emerging markets such as India and Brazil. With the launch of Android One for emerging markets, Google has found another opportunity to tap into a growing user base. The rapid increase of new users through local smartphone vendors will continue to push Google’s Play store revenue from games to new heights  in the coming years.

Apple iOS App Store Game Revenue Grew Over 70% Y-O-Y

The consumer spending on games in the Apple App store remained flat Y-O-Y. However, games continue to generate a tremendous amount of revenue for Apple and between Q2 2013 and Q2 2014, the iOS app store gaming revenue grew by 70%. The three main countries driving Apple’s mobile gaming revenue are the US, China and Japan. During Q2 2014, iOS game revenue generated 2.4 times as much as Google Play store in the US.

app annie 3

Apple’s dominance in the gaming revenue segment is natural as Apple users spend 45% more on average than Android users, and are also more likely to be mass consumers of entertainment. The launch of the large screen iPhone 6 device will undoubtedly attract customers who prefer large screen phablets for gaming. This will in turn will attract more developers seeking maximum monetization opportunities.

Gaming Optimized Handheld Device Sales Continue To Slide

The installed user base of handheld devices optimized for gaming declined to under 200 million during Q2 2014. Devices sales of the Nintendo 3DS, 2DS, DS, DSi, Sony PlayStation Vita and PSP all decreased drastically over the past one year. Total software and digital full game software shipment volume in Q2 2014 were 27% – lower than in Q2 2013. Revenue from gaming optimized handheld software also declined by 28% in the same period.  app annie 4

Although it was widely expected that the mobile gaming device market would eradicate the optimized handheld gaming device segment, the industry is expected to re-gain some seasonal growth once some of the bigger titles for those platforms come later this year. The Sony PlayStation Vita is one such device which is showing signs of life in a fast depleting gaming segment.

New Opportunities Await In Mobile Gaming

Developers are increasingly finding new ways to monetize from the burgeoning mobile gaming market. One such strategy is to use mobile games to promote upcoming movies. This extends the success of the brand even after the theatre release of the movie, and helps to create higher quality games and generate strong mobile engagement. As smartphone and tablet usage continues to soar worldwide, local developers will be benefited the most from the freemium model by publishing more mobile apps and games in their home countries.

Advertisement

How Brands Should Measure Social Media ROI Effectively!

0

With the explosive growth of the Internet, social media marketing has become an inevitable marketing strategy for brands today. Companies are spending million of their marketing dollars to lure more than two billion users available on social media without having any monitoring procedures that could measure the returns on investment, largely known as ROI. In fact, most of the social media marketing agencies find it really difficult to calculate what they are getting back, in particular, from their social media campaigns running on the injected investment by the client. The question has been looming for long now, but the answer lies in only one tactic: Testing !

Social Media ROI

Here is an infographic, released by QuickSprout, explaining how exactly a client or social media marketing agency should calculate the ROI of their each campaign on each social media network.

Setting your conversion goal must be the first step to start with. For every business, this would be unique, but eventually it’s a measurable action that would result in end purchase. Then, start tracking the defined conversion by monitoring traffic, leads, customers, reach and conversion rate.

Every conversion needs a monetary value to ensure that you are on the right track to measure accurate ROI. Though this is a bit tricky process sometimes, but its vital for the success of your social media strategy in place. Don’t forget to measure the total benefits by channel, as this will help you to identify channels that are responding to your marketing strategy positively.

Now, it’s time to calculate the total investment per channel, add fees, labor cost and sundry cost of each channel separately and then add up all the cost to find out total investment.

Finally, you have to analyze the results by making few simple calculations and see if the returns from each social channel are meeting your expectations.

You can have a look on the below infographic that explains the whole procedure with the help of various examples at every level. Implement these steps in your next social media campaign and see if you are really churning out money from each of social network your campaign are running on.

social-media-ROI

Advertisement

Startups MUST Watch Their Brand Reputation Online And Offline Both !

0

The Internet is a vast, unregulated community of 3.4 billion people and it has both useful and challenging sides. The free availability of information plays an important and, often, positive role. However, this also means information that disparages you and may affect your image is there for all to see. This could have an impact on your business and prove to a turn-off for those who would want to deal with you.

Thus, your online reputation management matters. What people discover when they Google your company’s name is affecting their decisions to do business with your organization?

The large number of online tools that people use to publish their opinions — social networking sites, consumer feedback channels, blogs and forums being some of the available options — make it difficult to track your brand perception. Poor and biased reviews can damage your brand perception, garnering adverse publicity for your products. Not only this, companies that have their own social media sites require a proper procedure and therefore need a thorough social media management plan. This is because if proper social media marketing is not in place, it becomes detrimental to the online image of the company.

online-brand-reputation-management

The intention is not to deal with everyone who posts a negative comment but to build a solid reputation. The process often involves managing and monitoring your digital profile as well as the “public” aspect of your online presence. This can be achieved through careful online reputation management, or companies can also adhere to ORM services. A lack of public participation on your website does not mean that the rest of the web is not discussing you. The idea is to step into the large opinion pool as an arbitrator of your image.

Avoid bad press at all costs

A few startling facts highlight how important it is to maintain a credible reputation on the Internet. Around a billion names are looked up daily on search engines, research suggests. One of these names could most easily be yours. Moreover, those searching could be not only the average citizen but also Fortune 500 companies. What they see in comments and posts on online forums and social networks is what they would more readily believe.

Incredibly, more than 70% of people trust strangers’ reviews to make purchase decisions. This gives you all the more reason to monitor (and possibly manage) online search results. While positive search results would naturally lead to more fruitful business associations, negative reviews could hurt your brand perception and, consequently, derail your chances of growing your business. 

Natural Allies – Branding and Online Reputation Management

Branding has always been the buzzword in the market landscape.The aim of the exercise is to create strong associations with your brand in the minds of consumers.

Cola majors Pepsi and Coca-Cola have taken branding to a whole new level on the Internet. Both companies spend large sums of money every year in the hope of becoming the ultimate cola brand on the Web. Their advertisements rarely try direct selling of the product. Instead, they make the brand name stronger. The effort is directed at creating an association between the provider and the product. This shows that branding helps to maintain the reputation in every digital medium. After all, reputation frequently is crucial for business. Maintaining a credible reputation is about using your brand as a vehicle to trigger online buzz. Companies, these days, all around the world provide excellent ORS services which can be availed by organizations to lessen their worries about proper online brand management and social media management.

Don’t ignore your Offline activities either

Time and effort need to be invested in maintaining a credible reputation and achieving social media optimization. Tracking online chatter, using tools such as Google Trends, is a necessary process. Even then, you must remember that negative feedback is inevitable.

Creating a great online presence broadly involves two steps: finding out how your target groups spend time while surfing the Internet and then evolving strategies to engage them using the channels that they prefer by improvising on value.

Starbucks, for example, streamlined their rewards program on their smartphone app and tied it to the physical card with real-time rewards. This the café chain did to overcome competition. The aim was achieved by engaging Twitter followers in their market landscape, including by sending best-of-luck messages to student patrons before their exams and encouraging people to try Starbucks-themed nail art.

To help customers stay in the café instead of opting for the takeaway service, they also offer perks like free Wi-Fi. For their offline branding, they have a red cup that rings every year in the holidays. The company has also featured winners of some contests on promotional posters as a means of creating engagement.

Why does it matter?

As the Internet becomes more pervasive, customers will become likelier first to encounter a brand online. Even if a brand is noticed in an offline space, it would soon be followed by an online search. In such a scenario, it makes sense to take an integrated approach to brand and online reputation management. This is an approach that is seamless across all platforms, even as appropriate links are maintained between the digital and physical presence of the brand.

Author Bio: Reeya Bose is a research and communication expert at a global research firm that conducts business research and provides online reputation management services. She helps firms gain actionable insights based on technology and best practices, thorough, detailed market study and analysis.

Advertisement

Apple Inc. (AAPL) New iPad Air Coming On October 21 !

1

Apple Inc. (NASDAQ:AAPL) is all set to launch new iPad Air on October 21 at an event, reported Daily Dot, citing the sources familiar with the development. Apple iPad would be reportedly unveiled in two variants along with the new version of its Mac operating system.

Earlier rumors also claimed that Apple will hold two separate events for iPhone and iPad launch this year. While Apple unveiled iPhone 6 and iPhone 6 Plus along with Apple Watch in a recently held event on September 9, the company is gearing up for the next event to introduce the new lineup of iPad. According to the sources, Apple would introduce a sixth generation of iPad, purportedly known as iPad Air 2, and the third edition of iPad Mini at the event. Besides, Apple will also make a public launch of its new Mac operating system OS X Yosemite, which has gone through a complete visual and functional overhaul. The developer preview and the first beta version of the Mac operating system is already been released.

Apple ipad-air-2-launch

However, Apple’s spokeswomen declined to comment on the rumor.

The sixth generation of iPad would sport 9.7-inch Retina display while the new third edition of iPad will also have a 7.9-inch screen. Apple’s aggressive launch strategy is being seen as the preparation for the upcoming holiday season. Every year Apple sells record units of iPhone and iPad during the holiday season, making its first fiscal quarter the most profitable quarter of the year. In the last two quarters, Apple failed to meet market expectations; in the second calendar quarter of 2014 Apple sold 13.3 million units of iPad, failing to meet analysts’ projection for 14 million sales. Consequently, the year-over-year growth of Apple iPad declined by 9.3% during the second quarter of 2014, while the overall tablet industry recorded 11% growth during the same quarter.

Worldwide Tablet Market by Screen Size 2014 - 2018

Apple introduced iPad Mini first time in 2012 expecting to grab a sizable chunk of the growing small-screen tablet market. In 2013, tablets with screen size between 7 and 8 inch controlled 55% of total tablet market, while in 2014, it’s estimated to grab almost half of total tablet shipments. Unfortunately, the Apple iPad Mini is yet to meet the expectations as the sales of Apple iPad Mini is not helping much as the overall iPad sales has been declining for the last few quarters.

Rumors are also making the rounds that Apple may introduce a bigger screen iPad this time. Few earlier reports have claimed that Apple is testing five models of iPad sporting a 12.9-inch display. A few sources have claimed that Apple will also introduce fingerprint scanner, like in the iPhone, with the upcoming iPad for the first time.

Advertisement

Apple Inc. (AAPL) And Samsung To Control 45% Of Worldwide Smartphone Shipments In 2014 !

1

Apple Inc. (NASDAQ:AAPL) and Samsung Electronics Co. Ltd. (KRX:005935) would continue to enjoy their dominance over the global smartphone industry with a combined market share of 45% in 2014. It’s estimated that the number of smartphone shipments in 2014 will reach 1.2 billion, an increase of 18% from the last year, according to the latest report from the research firm Juniper Research.

With businesses still underestimating the power that small screens have brought with them over the past years, for the one’s still finding themselves behind ramparts of the traditional PC content shouldn’t be surprised if they are virtually invisible from the consumer’s list. However committed the former may be to cater to the demands of the consumer, the ease of availability of searching the contents has been one of the top priorities amongst the buyers. At least that is what the shipping numbers of the smartphones suggest.

worldwide smartphone shipments 2014

Samsung and Apple tops the chart, Huawei continues to grow

Driven by large screen devices, low cost and aggressive price point offerings, the worldwide smartphone market touched another landmark with shipments of around one billion units in a record time period of one year in 2013. With a year-over-year change of around 67.5%, Huawei continue to emerge as a strong future rival to the likes of Samsung and Apple who have sustained the top notched positions with a staggering shipment figure of 313.9 million units and 153.4 million units respectively compared to 48.8 million units of Huawei last year. Selling low-end models in foreign land, flagship products like Ascend P7, Ascend Mate 2 in mainland China and backed by its growth in emerging markets like the Middle East, Africa etc., Huawei plans to spend more on awareness campaigns and marketing details targeting to become a top-tier player in the field of smartphones.

Small screen is the new rage

smartphones-vs-desktops

According to a report by Gartner, with the traditional PC (Desk based and Notebook) seeing a decline of 6.6% from 296 million units in 2013 to 276 million units in 2014, Utramobile and Tablets saw an upsurge in the worldwide shipment. However, major shift in the consumer preferences was observed with the increase in smartphone shipments. With Mobile phones recording a growth of 4.9% from 1.80 billion units in 2013 to 1.89 billion units in 2014 and an overwhelming figure of 38.6% rise in Tablets worldwide shipments from 195 million units in 2013 to 207 million in 2014 has shown how the customers are making room for anticipated launches in the late quarter of 2014.

IDC Research Manager Ramon Llamas opined about the massive potential audience for smartphones, 78.1% by 2018, suggesting that for businesses not delivering up to expectations may find themselves in a hitch.

Challenge to keep up with the expectations

Albeit the soaring of the worldwide shipment of these devices have helped vendors increase average selling prices (ASPs), the challenges are to go hand in hand. A clear trend of consumers waiting for new screens calling out for mobile content that will look good on them, to hit the market, garner popularity and suit reviews, they tend to grab hold of the product with the fall or holiday season. This has led the businesses to take a fresh perspective over the current and the future needs of the potential buyers. Availability of tablets on a lower price and shift in choices from hardware to software has witnessed consumer’s split preferences between basic tablets and premium ones with the sale of the later anticipated to decline faster as would have been expected few years back. With the increased penetration of smartphones into the mass, the prices are expected to dip in a progressive way eventually even lowering the marginsThe BYOD policy is gaining acceptance with individual looking for owned-devices. It is expected that it will increase to 72% in 2017 as compared to 65% in 2013 and so will the security concerns of the enterprises.

The new and rising vendors will be continue to proliferate

Although developed economies will definitely continue to be the dominating factor, the emerging ones are making sure to close the gap between mature and emerging markets by playing a vital role in the market shares. As Juniper Research noted, with low-cost economy smartphones from $75 to $150 and ultra-economy smartphones costing under $75 smaller smartphone vendors will become ambitious with time.

Apple and Samsung won’t have an easy road ahead

xiaomi-mi3-2

Though the Apple and Samsung continue to share lion’s share of shipments, they saw a fall in their shares. Dropping to 25.2 percent in the second quarter of 2014 from 32.6 percent in the same quarter a year ago, Samsung’s shared its fate of losing share in the market with Apple, whose share dropped to 11.9 percent from 13.4 percent during the same period. Vendors in emerging markets like Xiaomi, who have succeeded to woo the Indian and China market, will continue to rival these big giants, Juniper said. With a second-quarter market share rise to 5.1 % from 1.8 % in the same quarter last year, Xiaomi has stunned the market by showing itself in the list as a star performer with shipments surging to 15.1 million from 4.1 million becoming fifth largest smartphone maker. Apple and Samsung have a tough road to travel ahead.

Advertisement

26% Of TV Viewers Go Online To Watch Shows Using Various Mobile Devices [GMIC Series]

0

It’s not surprising that today’s generation on an average is spending five hours and 16 minutes in front of a screen, but the startling element involved with this fact is that this span of time is spent without even switching on the television sets. These statistics were deduced by eMarketer, a social media research and analysis firm some time back which pointed out the increased devotion of the folks to smartphones, laptops and tablets each day. Hence, these figures clearly illustrate that in recent times there has been a drastic change in the definition of what counts as TV-watching!

With the launch of plethora of new devices and platforms, people are now actually indulged in watching more television programs than they used to some years back. The main reason for this changing trend has been the availability of the traditional cable TV online on mobiles and tablets either for free or in lieu of some bucks. Furthermore, the emergence of new television-related applications and technologies like multiscreen viewing and social media interaction has completely changed the behavior towards television in today’s scenario.

But the rate of adoption of these newer modes of digital broadcasting has not been same for every segment of society as not everyone have been preferring OTT TV or an Internet Television and yet there exists a class of viewers who considers the old idiot box to be far better than other sources. According to a report published by Strategy analytics based on a survey of 6000 US and European viewers, the love of people for TV has not yet deteriorated but the ways in which they are consuming it has changed drastically in a variety of ways.

The various classes of TV viewers

The segment of traditional couch potatoes, which prefer the conventional mode of TV rather than the online/OTT services yet account for the biggest segment of TV viewers which is 33%, but there has been a significant downfall in their numbers when considering that this was the commonest mode of watching TV some years back. Along with this classic couched class, a related segment of TV viewers was also highlighted in the survey aliased as Couch Chatters who also like watching TV more on an average but are majorly involved in chatting with friends what’s there on TV. Rest this chunk of viewers are least engaged in any sort of emerging activity like social networking related to TV or watching it online, and they account for 12% of total viewers.

MultiScreen TV Viewership 2014

The second largest class identified was of TV OTTers, comprising of 26% of viewers who prefer going online to watch specific shows using the new devices like laptops, mobile or tablets rather than viewing them on the television, but this segment also avoids communication of these shows with friends or others like the couch potatoes. The remaining groups consisted of all multiscreeners which have been further subdivided into three more disparate groups – Moderate, Indifferent and Maniac multiscreeners. Moderate and Indifferent multiscreeners both account for 11% of total audience and engage in most online TV and social media behaviors around TV with the exception that moderates do not follow TV shows using Twitter whereas the Indifferents do so and the latter are more likely to use smartphones, tablets and PCs to watch TV content. The last segment and the smallest group is of the Maniac’s which account for 7% of viewers and they are most likely to use service provider like VOD and OTT, online TV or video services along with each Maniac claiming to follow TV shows using Twitter.

The television companies and advertisers missing on both couch segments while targeting Millennials

The television content firms and the advertisers which are targeting millenials for extending their realms to target groups who favor these emerging trends of viewing are being disguised by the segment of couch potatoes and couch chatters because a substantial 30% of these millennial constitute both these clusters. Hence the firms catering the social media platforms and online ad campaigns are surely missing these segments of viewers which primarily consist of the audience aged below 35.

On the whole, there has been a slight increase in the ratio of people favoring the emerging trends to the traditional viewing attributes in US and the European nations that is 11:9. These emergent traits which include the incorporation of the elements of the multiscreen or online viewing amalgamated with activities related to consumption and communication around television would definitely turn out to be the driving factors in shaping the future of television over the coming years.  

This post is a part of GMIC-Dazeinfo knowledge partnership series. Asia’ largest Mobile and Internet Conference GMIC will bring together mobile industry executives, experts, entrepreneurs and developers at Vivanta by Taj – Yeshwantpur in Bangalore on 26th Sepetember, 2014. The latest edition of GMIC Beijing in May attracted more than 20,000 attendees. In addition to Beijing and Bangalore, GMIC is also hosted in San Francisco and Tokyo. You can apply to grab free Silver passes by following this link

Advertisement