
As the adoption of smartphones and the Internet have surged over the last 2-3 years, so has app usage. The covid-19 lockdown has also boosted the usage of mobile apps as people turned to their mobile devices for almost everything, from entertainment to office work, online shopping, and other activities.
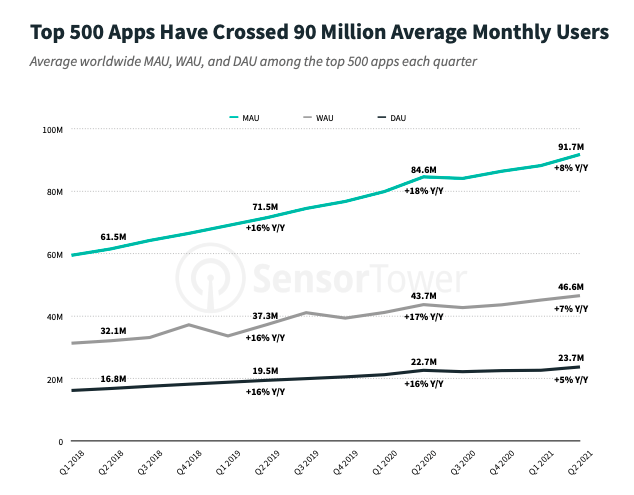
The average active users, consumer spending, and consumer engagement of the world’s top apps have grown steadily since 2018. The latest report State of App Engagement 2021 from Sensor Tower reveals that the world’s top 500 apps averaged a record 91.7 million monthly active users in Q2 2021, up 8.4% YoY.
Interestingly, the number of MAUs of global top 500 apps increased from 61.5 million in Q2 2018, to 84.6 million in Q2 2020. However, as the chart shows, the average active users have declined slightly in Q3 2020, the growth rates have since returned to pre-pandemic levels. Despite this, the impact on certain app categories has been much longer-lasting.
Top App Categories By Active Users
Utilities, Games, and Social Networking were the top three categories by MAU, WAU, and DAU for the top 100 apps worldwide in Q2 2021.
The world’s top 100 social networking apps had the highest average weekly active users of 58 million and daily active users of 39.1 million. This shows people use social networking apps such as Facebook, Twitter, Instagram more frequently than any other app. On the other hand, the top 100 apps by Utilities and Games had the highest average monthly active users of 95.2 million and 94.1 million, respectively. Social networking stands at third, with 83.8 million MAUs.
However, when it comes to growth, Social Networking witnessed the fastest MAU growth, with a 17.4 percent CAGR between Q1 2018 and Q2 2021. This is followed by the Games category, which grew at a CAGR of 17 percent by average MAU among the top 100 apps worldwide. Surprisingly, the average MAU of the top 100 Utility apps grew at a CAGR of 8.5 percent.
Business Apps Are Fastest-Growing By MAUs
The adoption of business apps surged to an all-time high at the start of the Covid-19 pandemic as people shifted to mobile apps for their office work. As a result, the average monthly active users of the top 100 business apps skyrocketed in 2020 and continued till the second quarter of 2021, making it the fastest-growing category in terms of global active users’ growth. Since Q1 2018, the average MAU of the top 100 business apps has grown at a compound annual growth rate (CAGR) of nearly 42%.
The COVID-19 lockdown had the greatest impact on Travel and Navigation apps. However, these categories have started showing the growth in their MAUs as vaccines have allowed some countries to lift travel restrictions. Since Q1 2018, the Travel category has grown at a CAGR of +1.5 percent in terms of average MAU among the top 100 apps.
World’s Top Apps By Daily Time Spent
The number of MAUs of global top 500 apps has increased in the last 2 years, while daily time spent has slightly decreased. In Q2 2021, the average daily time spent among the top 500 iOS apps by MAUs was 19.8 minutes. This is a slight decrease in average daily time spent compared to the beginning of the Covid-19 pandemic. In Q2 2020, global users spent an average of 21.3 minutes per day in each app among the top 500 iOS apps.
In Q2 2021, consumers spent the most time on entertainment apps. On average, users of the top 100 iOS entertainment apps spent nearly 30 minutes per day in them. Social networking comes in second, with consumers spending an average of nearly 24 minutes per day in each of the top 100 apps. It is important to note that social networking users have more sessions per day, but they are shorter than those of Entertainment app users.
Games are the third most popular category, with users spent nearly 21.9 minutes per day in each of the top 100 apps.
