The future of marketing lies in mobiles. With 1.43 billion smartphone users all over the world, the opportunity for marketing has never been better. Over the course of a lifetime, an average American will spend 57,293 hours on a mobile device. The opportunity is becoming larger each day as the internet of things (IoT) promises to create 40 billion connected devices by the year 2020. This translates into 10 connected devices for every man, woman, and child on the planet.
Businesses are now accepting that the mobile devices are the best way of reaching out to more customers through mobile optimized websites and apps. Social media is gaining the most in the mobile landscape as ad revenues on social networks expected to reach US$11 billion by 2017. Already two-third of smartphone and tablet users access social networks from their devices. Over the next few years, mobile will continue to transform our lives in ways both personal and digital.
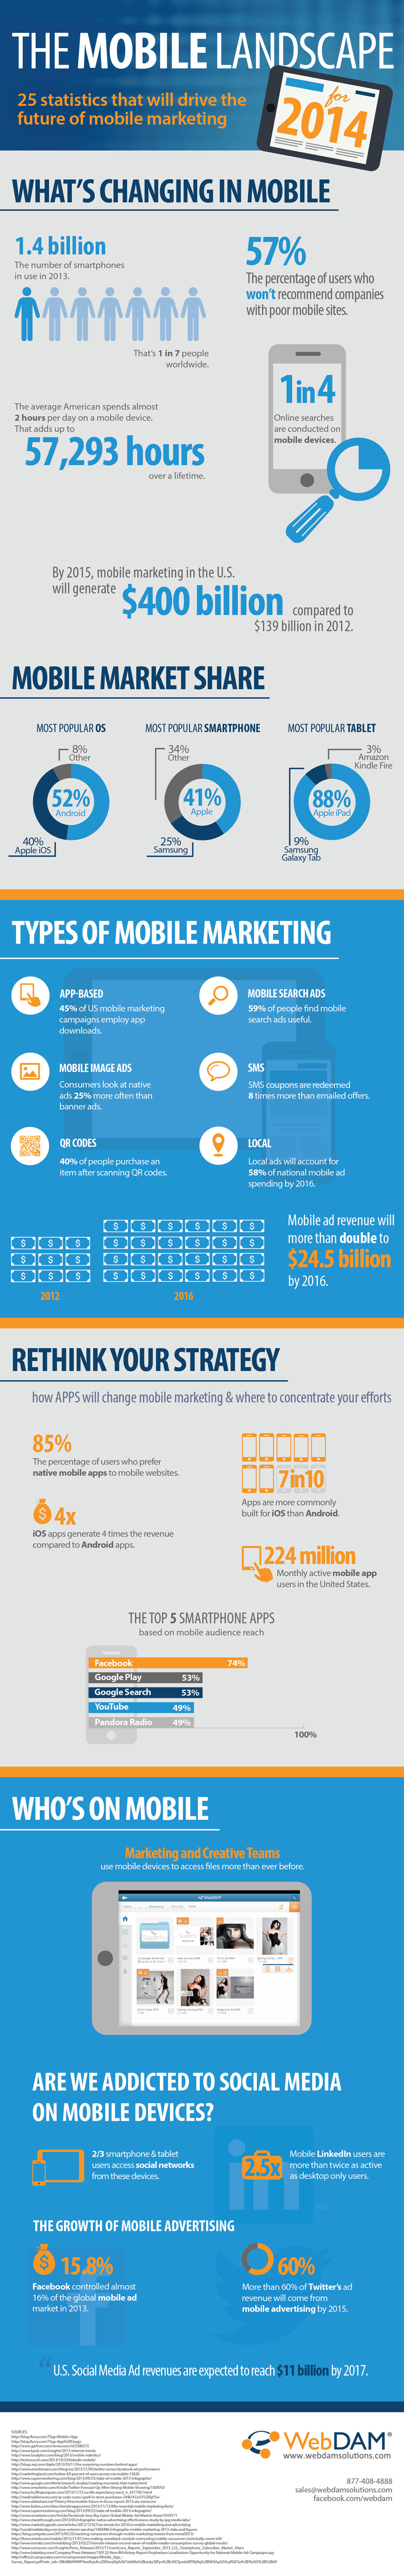
This infographic by WebDam solutions depicts 25 statistics about the current trends in mobile, the mobile market share, the growth of mobile usage and more.
- In 2013, there were 1.43 billion smartphone users, which means that one in 7 people worldwide owned a smartphone.
- 25% of online searches are conducted on mobile devices.
- 57% of users are unlikely to recommend companies with poor websites.
- Mobile marketing in the U.S. will generate an estimated US$400 billion, compared to US$139 billion in 2012.
- In the U.S. Apple iPhone is the most popular smartphone with a 41% market share and iPad most popular tablet with a market share of 88%.
- 59% of people found mobile search ads useful, while 40% purchase an item after scanning QR codes.
- 7 in 10 apps are more commonly built for iOS than Android. iOS apps are also 4 times more likely to generate more revenue compared to Android apps.
- Mobile ad revenue will more than double to US$24.5 billion by 2016.
- 85% of users prefer native apps to mobile websites.
- Facebook is the most popular app with 74% mobile audience reach, followed by Google Play with 53%
- Facebook controlled 16% of the mobile ad market in 2013, while 60% of Twitters ad revenue will come from mobile advertising in 2015.