It was ridiculous to talk about mobile app revenue market in 2010, but till the end of last year, the revenue from this source reached to all time high. Thanks to prevalence of Android and iOS mobile devices, which have fueled the worldwide mobile app revenue market. According to a latest report form Flurry Source 13, the U.S. leads among all countries in terms of active iOS and Android devices with 181 million units, followed by China, the U.K. and Japan with 167 million, 35 million and 28 million units respectively.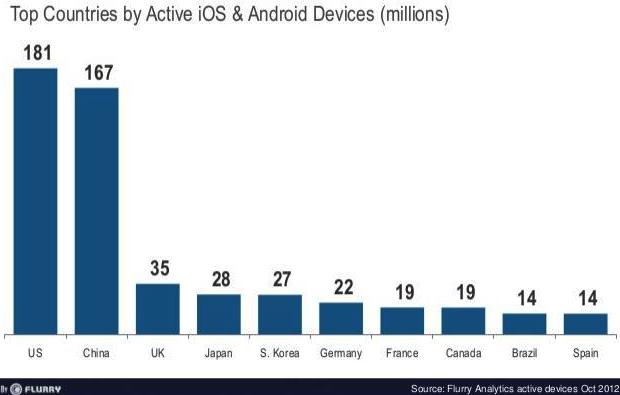
Mobile App Market Growth
On the other side, China tops in terms of year-over-year iOS and Android device growth. China showed off 293% Y/Y growth in iOS and Android device activation as of December end last year, followed by Vietnam with 269% and Colombia with 260%. China is now Apple’s second largest market, and expecting to reach the top position this year.

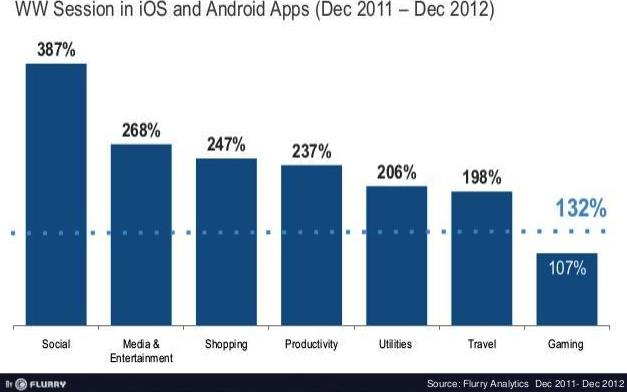
It’s really interesting to know about the app sessions on Android and iOS devices. As of December 2012, Social networking apps ranked first in terms of app session Y/Y growth with 387%, followed by media & entertainment, shopping and productivity apps with 268%, 247% and 237% respectively. At the time, users are more willing to access social networking sites on their mobile devices, and this is the main reason why Apple has deeply integrated Facebook app in its latest mobile OS (iOS 6). Now, travel apps are also gaining momentum across the world, surged 198% Y/Y in 2012.
Mobile App Revenue Growth
This time, advertisers are now focusing more on mobile platform to monetize their apps. Furthermore, mobile app revenue grew at the compound annual growth app (CAGR) of 129% between 2008 and 2012. It’s really interesting to know that mobile app industry did not exist before 2008, but at the end of the last year, the industry surpassed $18 billion revenue figure.

In September 2012, in terms of average revenue per daily active users among top 1,000 grossing iOS free-to-play games, 53% of transactions were under 25 cent ($0.25). On the other hand, a year before in September 2011, 82% of transactions were under 25 cent. Similarly, about 32% of transactions were between 25 and 75 cent in September 2012, up from 15% (transaction between 25 and 75 cent) a year ago.