
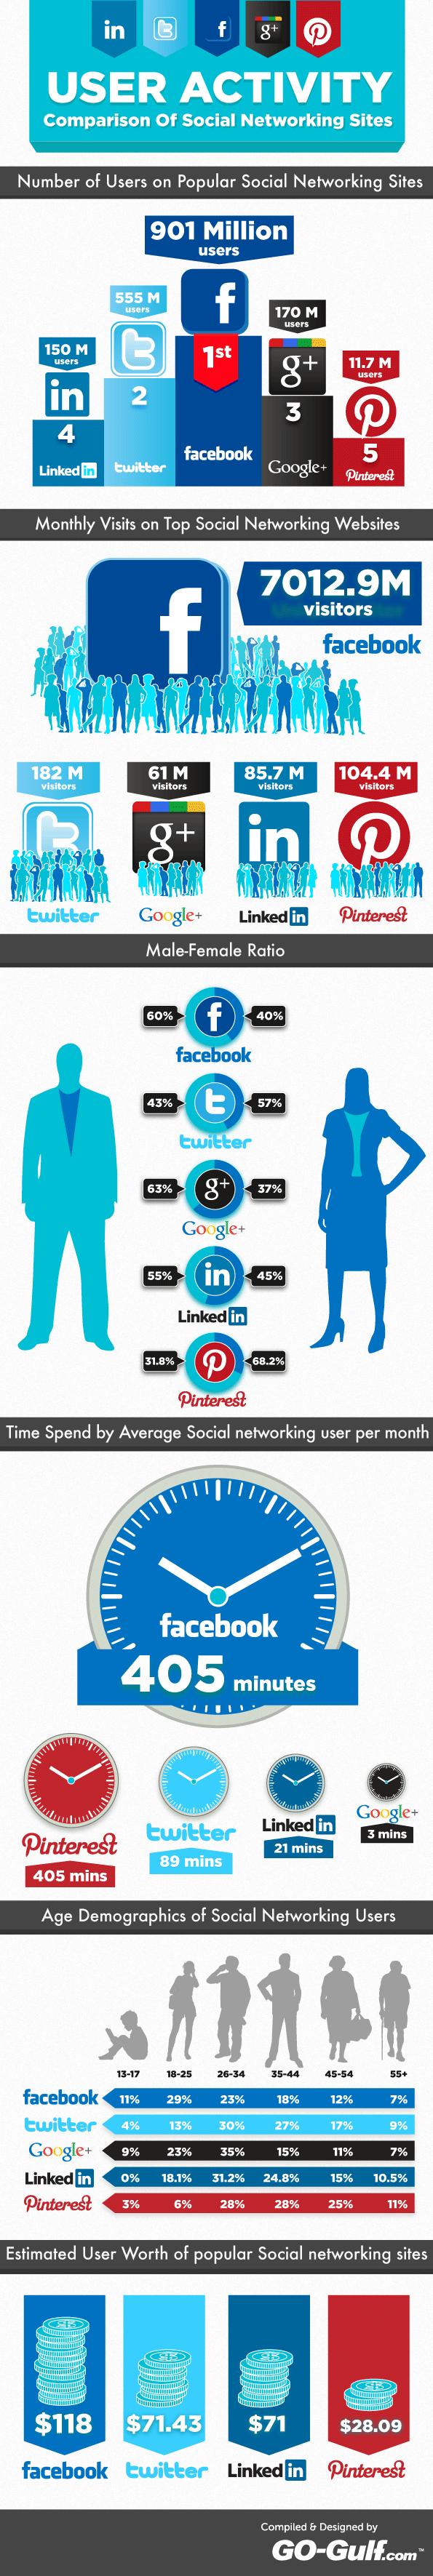
In this communication era, people revolve around social media, some are addicted, some use it to their advantage and the rest just kill time over it. With increase in the new emerging Social Media sites day by day, it is a fuss amongst the social media zombies over deciding which website is to be followed. Especially the branding companies tries to get influenced by almost all the “revenue garenteed” websites like Facebook, Twitter, LinkedIn, Google+, Pinterest etc. Facebook has over 901 million users followed by twitter with 500 million users ( result as per Twopcharts), LinkedIn with 150 million users, Google + with 170 million users and Pinterest with 11.7 million users.
Social Media Facts, Figures and Statistics 2012
Amazingly Google+ has the highest male ratio of 63% and Pinterest has the highest female ratio of 68.2%. There’s a tie between the Social media giant – Facebook and the new kid in the block – Pinterest with 405 minutes average time spent per month by users. Highest percentage of people fall between the age group 26-34 who mostly log in to social network sites. 30% of Twitter, 35% of Google+, 31.2% of LinkedIn and 28% of Pinterest users are from 26-34 age group. Following is an interesting infography about the various facts and figures of social media websites, the retailers using these websites and their fans.
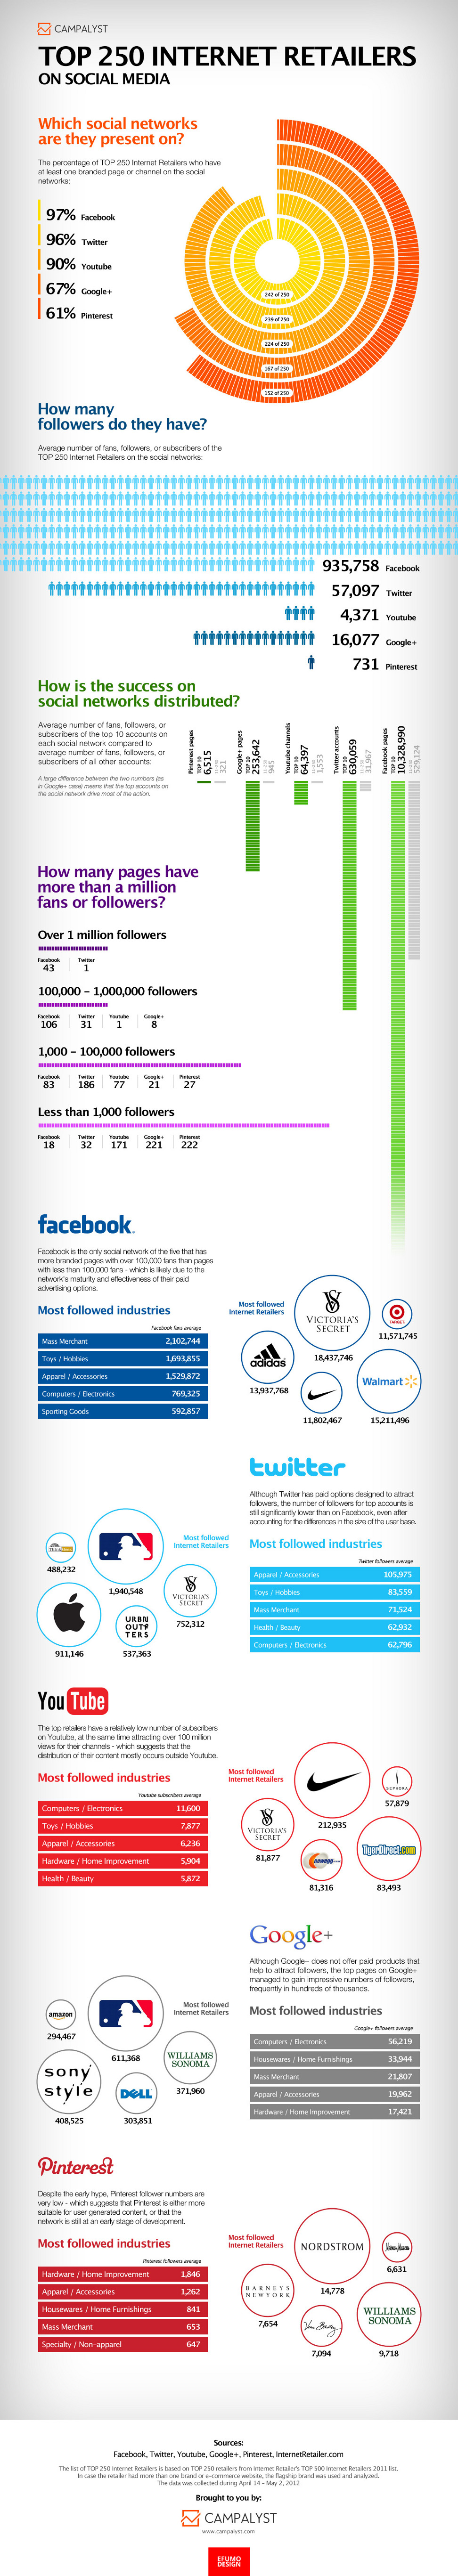
Social Media Top Retailers 2012
